You should use Equities Lab if
You manage US Equities

You manage ETF’s

You care about client returns

You’re adaptive

You explain investments

You analyze your trades
Simulate your trading rules
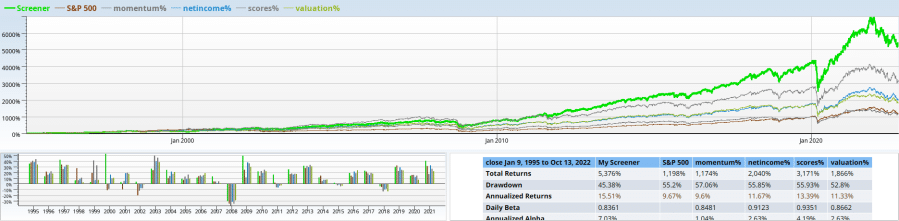
Some metrics you can use to understand your performance
Outliers
- Best/Worst position
- Best/Worst month
- Maximum drawdown
- Conditional value at risk
Metrics
- Trailing performance
- Annualized performance
- Alpha and beta
- Sharpe ratio
- Average number held
Probabilities
- Positions by percentile
- Months by percentile
- Odds by month of outperformance
- Odds by position of outperformance
Boost your performance
Find and refine your edge
- Use Technical analysis
- Momentum
- MacD
- Stochastic
- RSI
- numerous others
- Use Fundamental analysis
- Compose sophisticated valuation methods together
- Use safety and fraud detection scores
- Check leverage, risk, and more
- Use Macro data
- Pay attention to each part of the market
- Use Federal Reserve data
- Breadth indicators
- Put it all together
- Set a percentage of the conditions to match, for robustness
- Check conformance over time
- Mix and match
Build with confidence
- All fields searchable
- All equations easily readable
- Hovering gives tooltips
- Explore imported formulas, without losing your place
- Enable/Disable parts of the screen
- Easily test and debug
- Input as you desire
- Drag and drop
- Find fields in the tools menu
- Type abbreviations and formulas
- Cut and paste
- Reuse content
- Variables
- Formulas
- Macros
Build on existing strategies
Some of our most popular anomalies and formulas
Valuation metrics
- Fama-French Factors
- P/E, P/S, P/FCF, Price/Whatever
- EBITA/EV and variants
- PEG ratio
Safety and Fraud detection
- Piotroski F-score
- Altman Z-score
- Beneish M-score
- Ohlson O-score
Technical analysis
- Momentum
- MacD
- SMA, DMA and EMA
- Ichimoku clouds
- Triangles/Wedges
- More than 500 public formulas
- More than 500 public screeners
- More thinking, synthesis, and analysis in your student reports
- Combine valuation and momentum
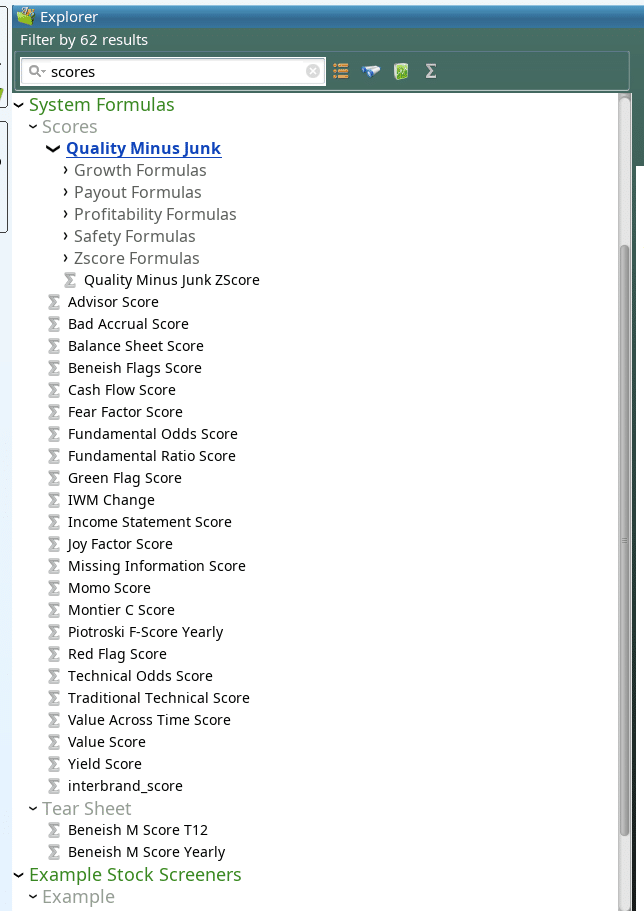
- Even complex formulas like AQR’s Quality Minus Junk can be easily modified and adapted for your use case
Communicate with your clients
Your ability to perform deep analysis gave you the ability to answer the question, and prevent the client from abandoning semiconductors. It also gave you both the confidence to not abruptly change course.
A sampling of visuals, and how they communicate
Heat Maps
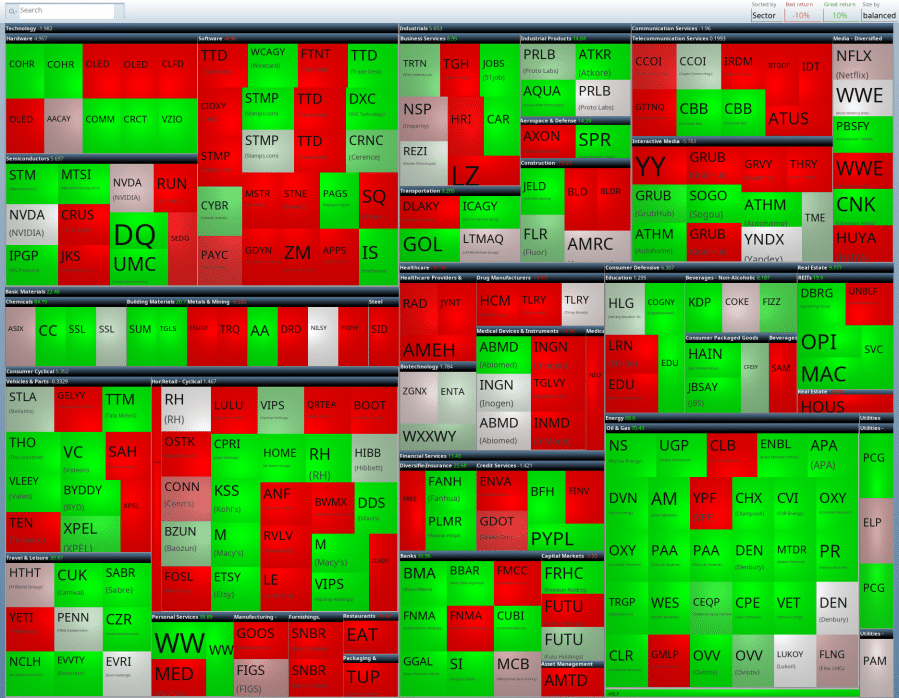
What’s going on here? Over this backtest, the energy stocks sector (bottom right) vastly outperformed the rest, driving the performance of this portfolio.
Scatter Charts
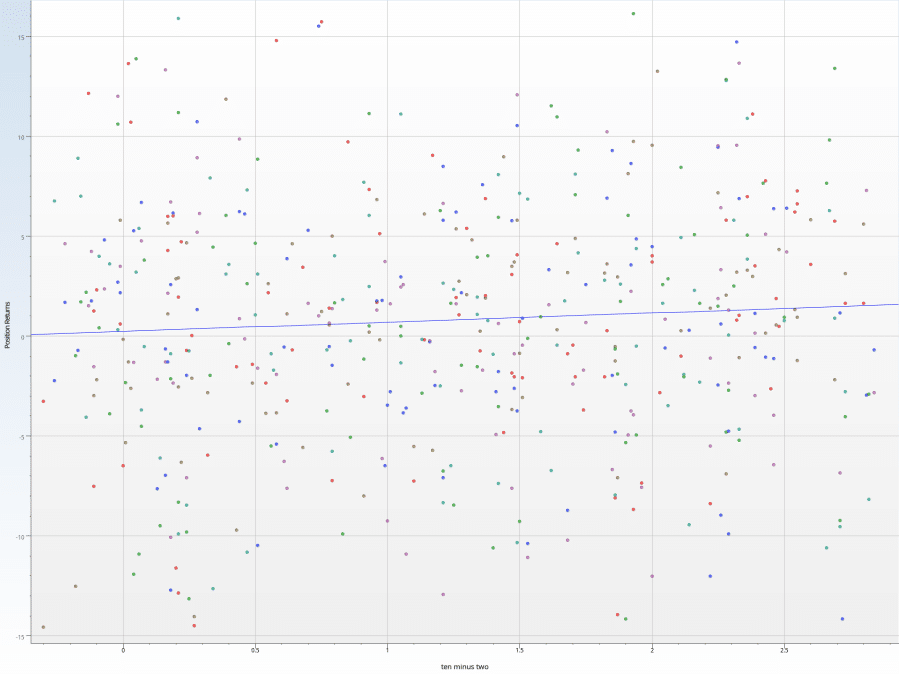
Do yield curves matter? See the linear correlation of performance vs. yield curve steepness: the steeper the curve, the better the performance.
Scatter Charts
The whole is greater than the sum of its parts. This strategy uses momentum, safety scores, valuation and income.
You can see each subcomponent tested along with the set of stocks that match all of the tests. Notice the handy stats and bar charts breaking down performance year by year.
Scatter Charts

See what works and what doesn’t in your portfolio. This disaster of a screen failed almost everywhere, except for industrials and energy.
Profile the market
- Compute the average PE of large caps
- Change the rules if one sector is performing too poorly relative to the others
- Find out if the bank stocks are more leveraged than they typically are
- Invest in the best three sectors
Clean and Reliable Data
Leverage Morningstar Data
Morningstar is an industry-leading data provider that Equities Lab uses to supply deep comprehensive financials on American, Canadian, and Australian equities. This allows us to simulate, with splits and dividends handled correctly, almost any trading strategy involving technical or fundamental criteria.
- 25,000+ companies, alive and dead
- 1,000+ financial data points, from AccountsPayable, AdditionalPaidInCapital and OtherIntangibleAssets through WorkInProgress to fields like UnbilledReceivables and UnearnedIncome
- Data going back to 1995
Leverage Macroeconomic Data
You can use any data series in the Federal Reserve of St Louis data set (FRED) to help your analysis.
- Cut and paste the URL into Equities Lab, allowing instantaneous use
- Browse our curated list of useful FRED indicators
- Use our custom search to find the right data series
You can also use Quandl data the same way. (Fair warning: most of the good feeds from Quandl now require extra fees.)
Leverage Data With Confidence
Delisted stocks
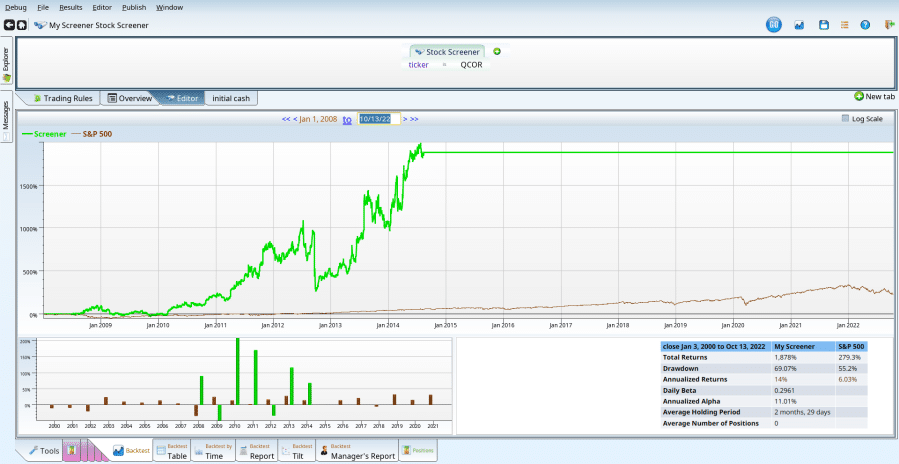
QCOR pioneered the process of buying up cheap generic drugs (Acthar for example) that people depended on, ensuring no one else could produce them, and hiking the price beyond all reason. Now that QCOR is a part of Mallinckrodt, this chart is hard to find, though you can find the FTC settlement.
Perhaps appropriately, Mallinckrodt is now emerging from Chapter 11 bankruptcy, because of its behavior in the Opioid crisis, making this chart even more challenging to find.
File dates really matter
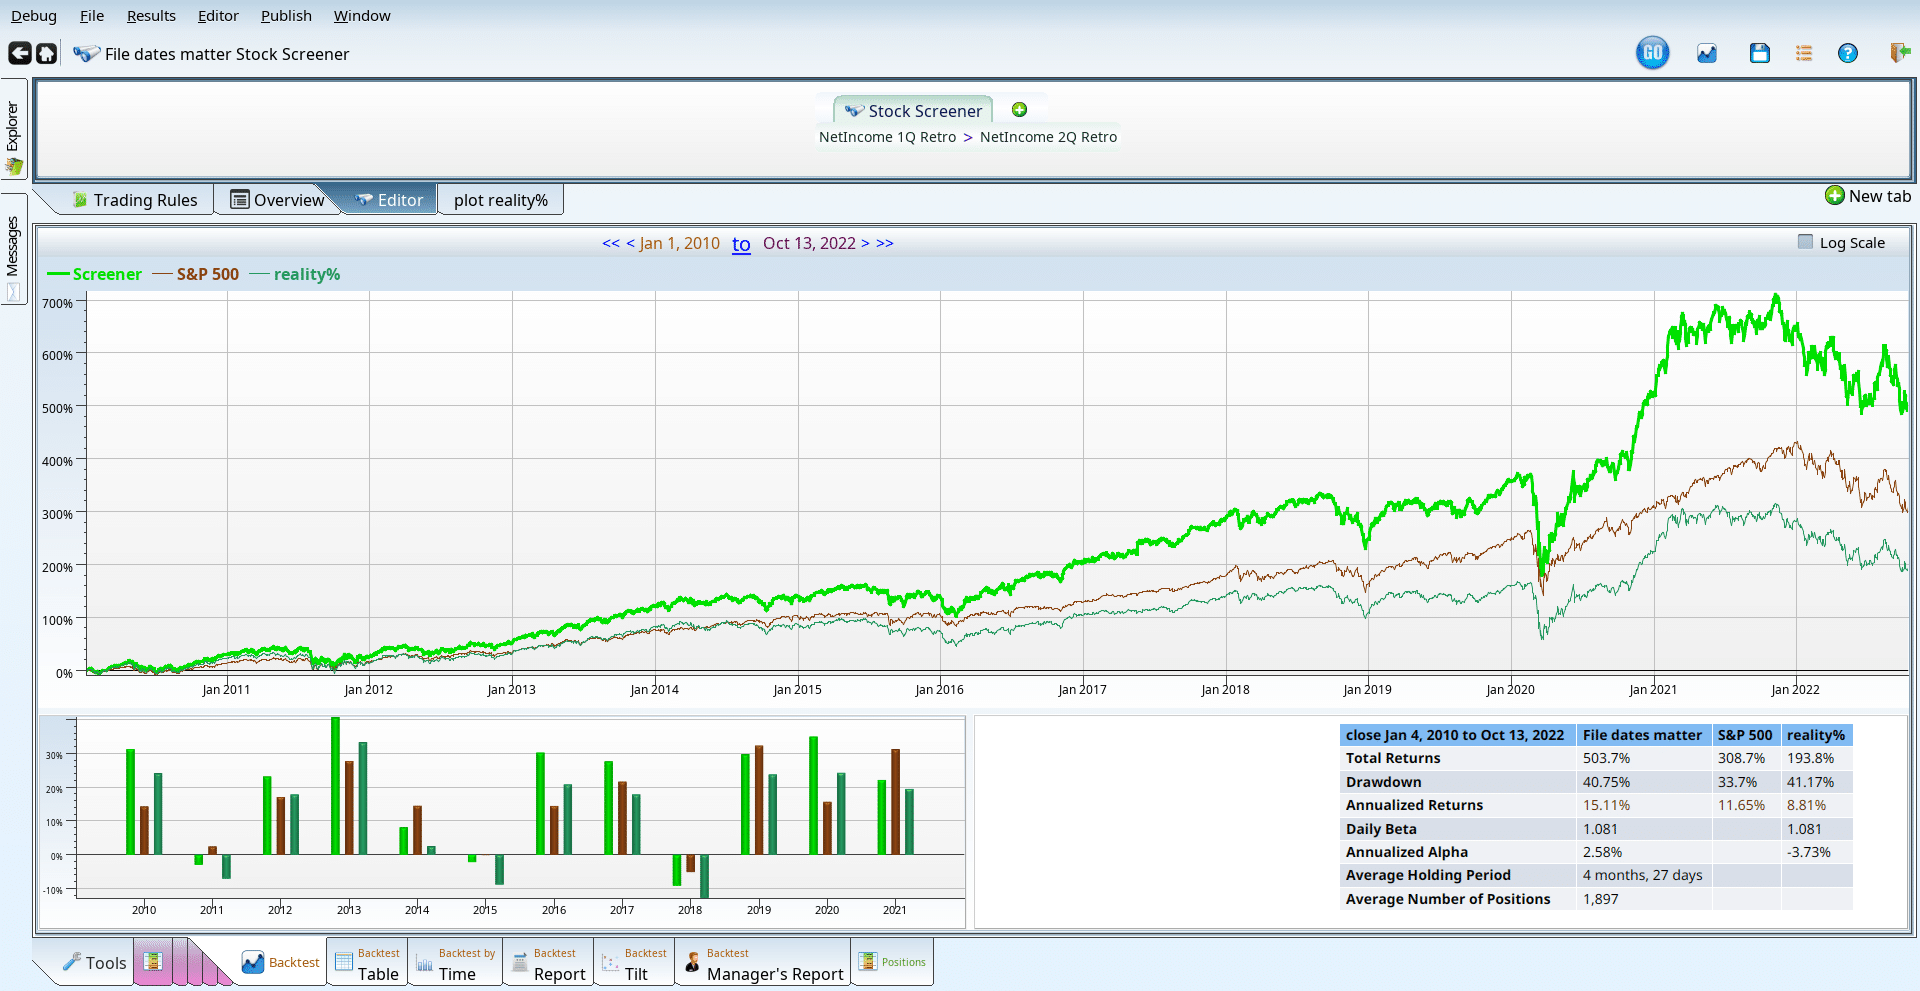
Why do so many people believe that fundamentals don’t matter and strategies based on them will not work in the real world?
One of the most common reasons is because many systems will apply the new quarterly data the day after the quarter closes, which is simply not possible to do without time travel or a heavy investment in insider trading sources.
Financial results take time to come out and be processed; neglecting these delays is a good way to ruin your analysis. Equities Lab correctly delays financials, so you don’t need a crystal ball to replicate your strategies.
Don’t invest in the uninvestable
Microcaps, unloved and under-analyzed, can be a great place to invest. That said, microcaps and other low volume stocks tend to be almost impossible to enter or exit.
For this reason we have configurable filters to filter out stocks that are too thinly traded, too minute, or otherwise exceptionally difficult to invest in. These stocks don’t show up in any rankings, backtests, or screens.
We also include user-configurable trading cost calculators if you wish for your students to dip their toes in those waters. Since the universe filter is configurable, you can loosen or tighten as desired.
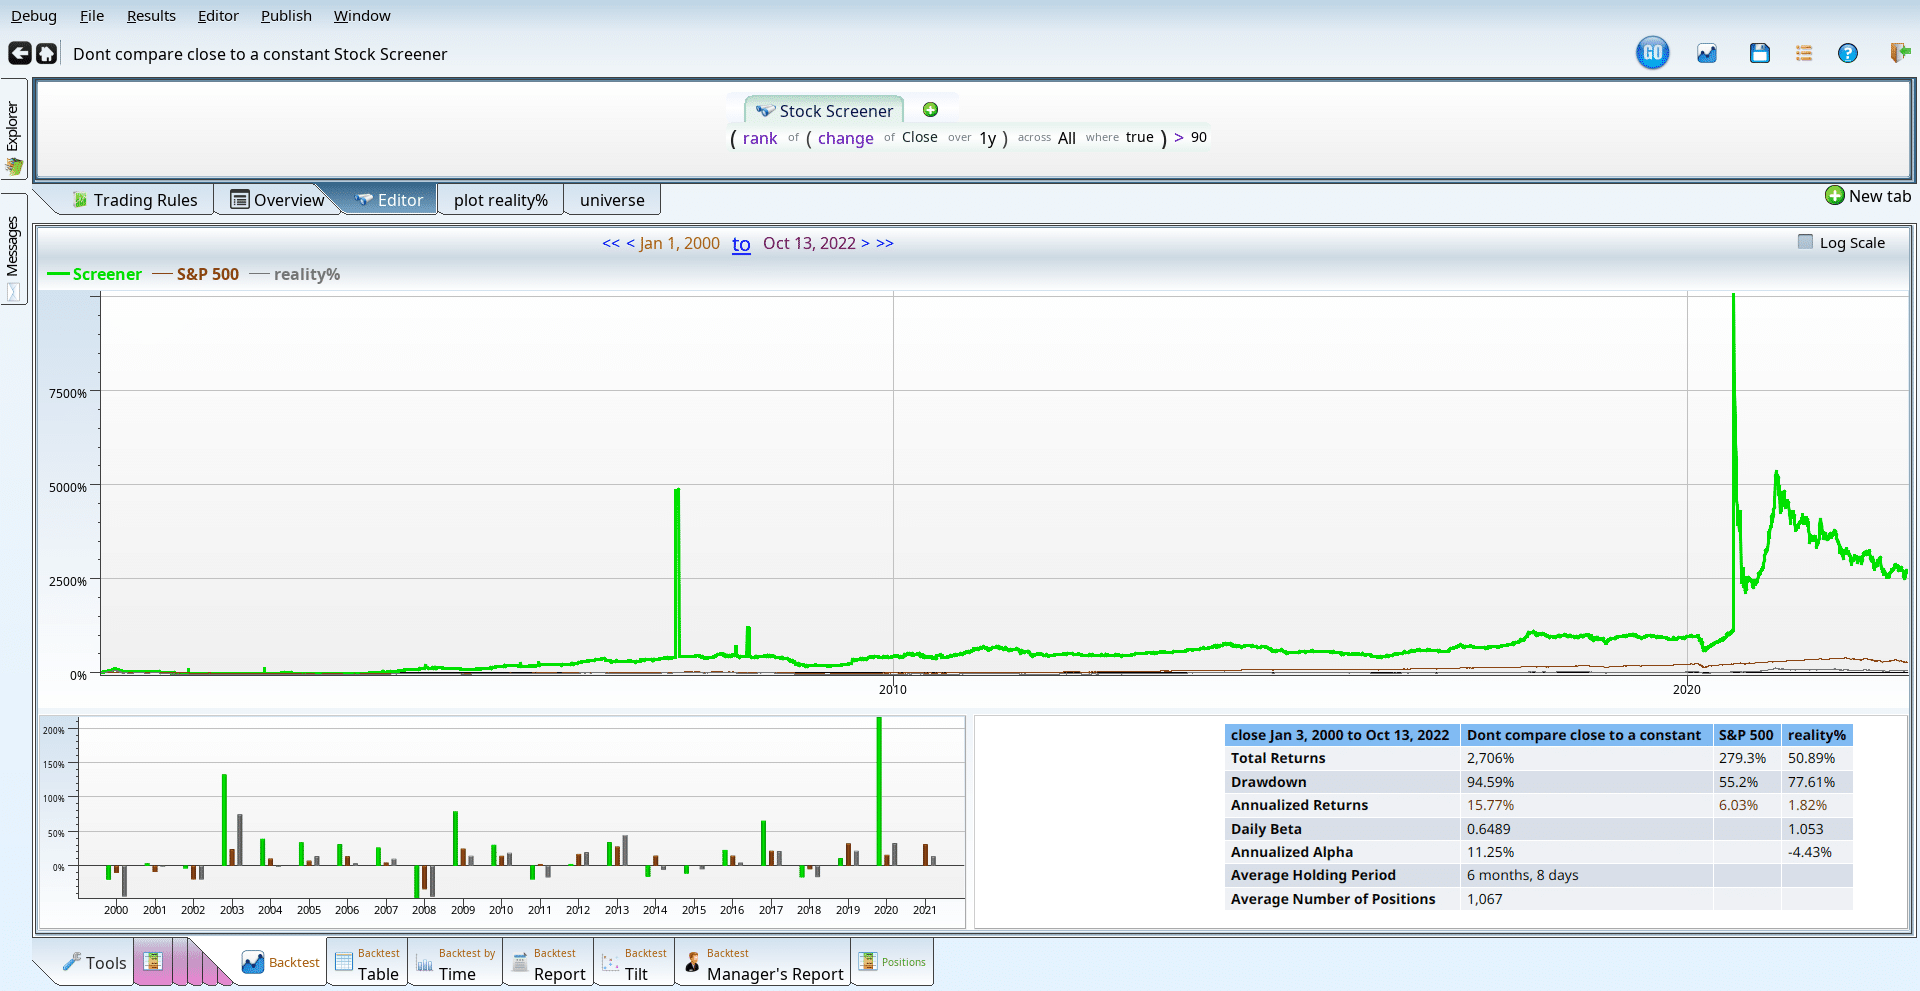
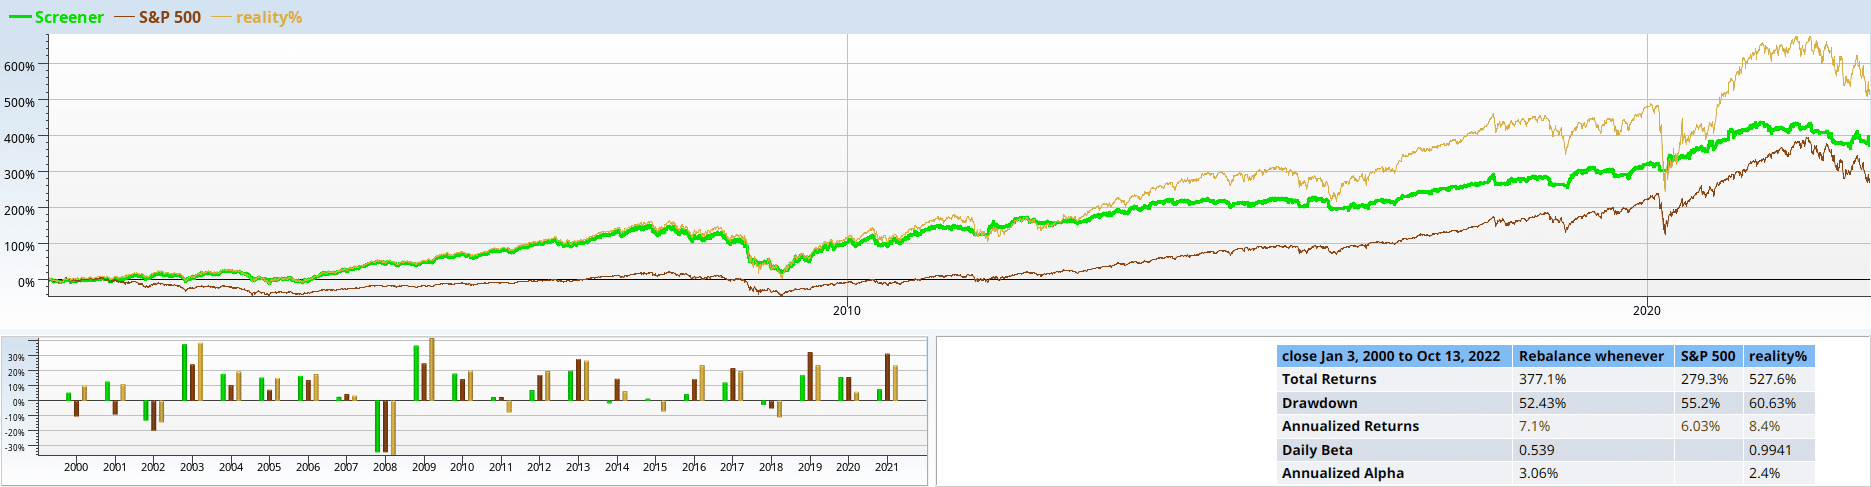
The perils of adjusted close
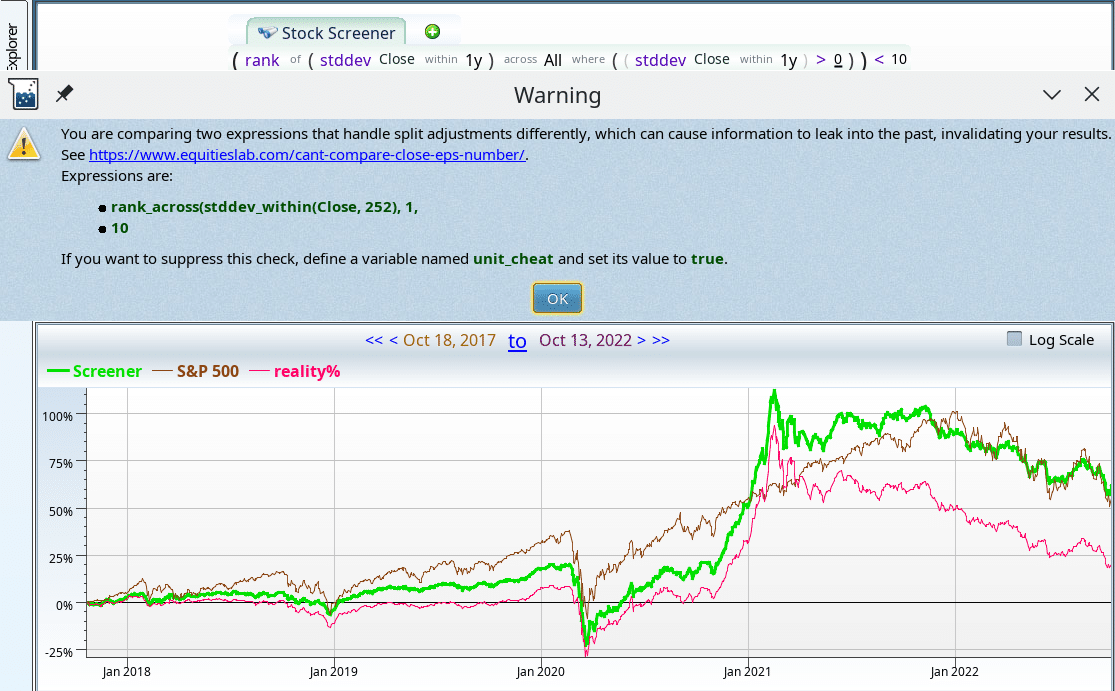
Using the standard deviation of Close in your formula seems safe, doesn’t it? Well, it’s not that simple…
Consider the chart above where the green screener line seems to compete well with the brown S&P 500 line. This strategy supposedly wins by taking the lowest quartile of standard deviation of Close. The red “reality” line is the much smoother, albeit much sadder line you get when using Raw Close instead.
Equities Lab will warn you every time your strategy uses adjusted fields in an unsafe way and provides a plethora of properties, such as RawClose and RawOpen, to avoid such pitfalls.
Powerful Portfolio handling
Configurable trading costs
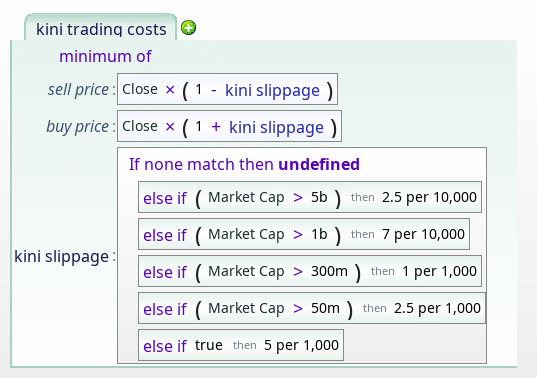
In real life, trading costs vary per stock and time, and can critically depend upon the details of your brokerage.
We model trading costs as slippage, which can be configured with a formula that can refer to any attribute of the security being traded. Set Market Cap cutoffs (as the Kini Trading Costs do), use average trading volume, or a composite based on your own specific needs.
Rebalance anytime
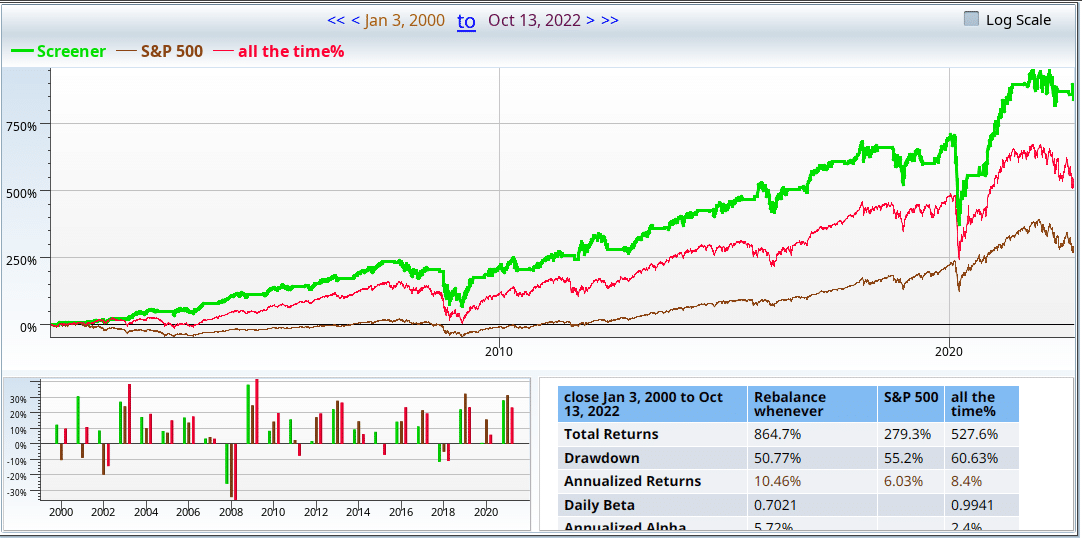
This piece of seasonal insanity takes a perfectly ordinary composite of a Beneish/Piotroski/Momentum strategy and overlays it with a seasonal refusal to hold during the summer months and certain bad holidays.
The really interesting thing here is that the screen rebalances every time we go from a vacation state to a non-vacation state. This happens several times a year, at irregular intervals. The red reality line is merely the screen itself outperforming the market.
Constrained Holding Periods
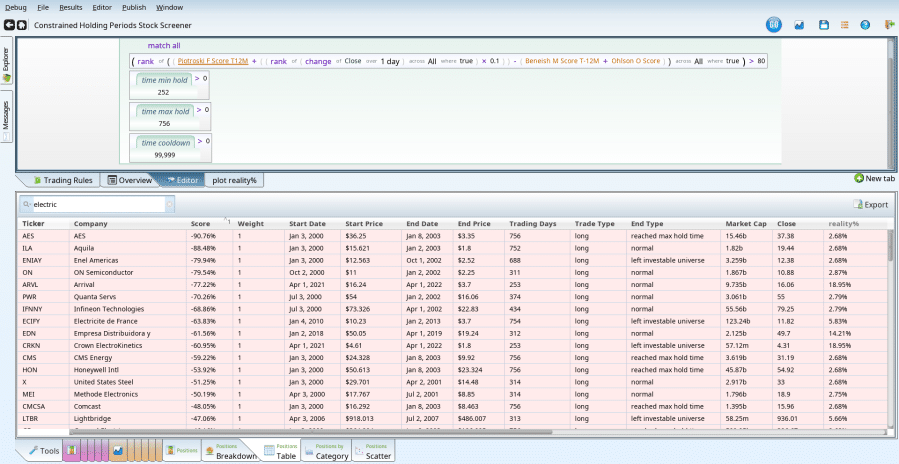
Investors are human. They won’t generally jump out of a position they just jumped into, and they may also refuse to buy something they previously sold that year.
Do these quirks make a difference? Find out! The grid above shows a list of trades where the investor trades quarterly, is unable to sell for at least one year, is unwilling to hold for more than three years, and never buys a stock that has been sold. As might be expected, this underperforms vs. the base strategy, which has outperformed since 2010.
Stop-losses or stop profits?
Stop-losses may reduce volatility, but they also impact performance. In the chart above, up until 2010, the green backtest line used a 20% stop-loss.
From 2010 onwards, the strategy is much stricter: a 10% trailing stop-loss.
The green backtest line follows the orange baseline until 2010, whereupon it just seems to run out of steam. Perhaps something is “stopping” it?
Long/Short
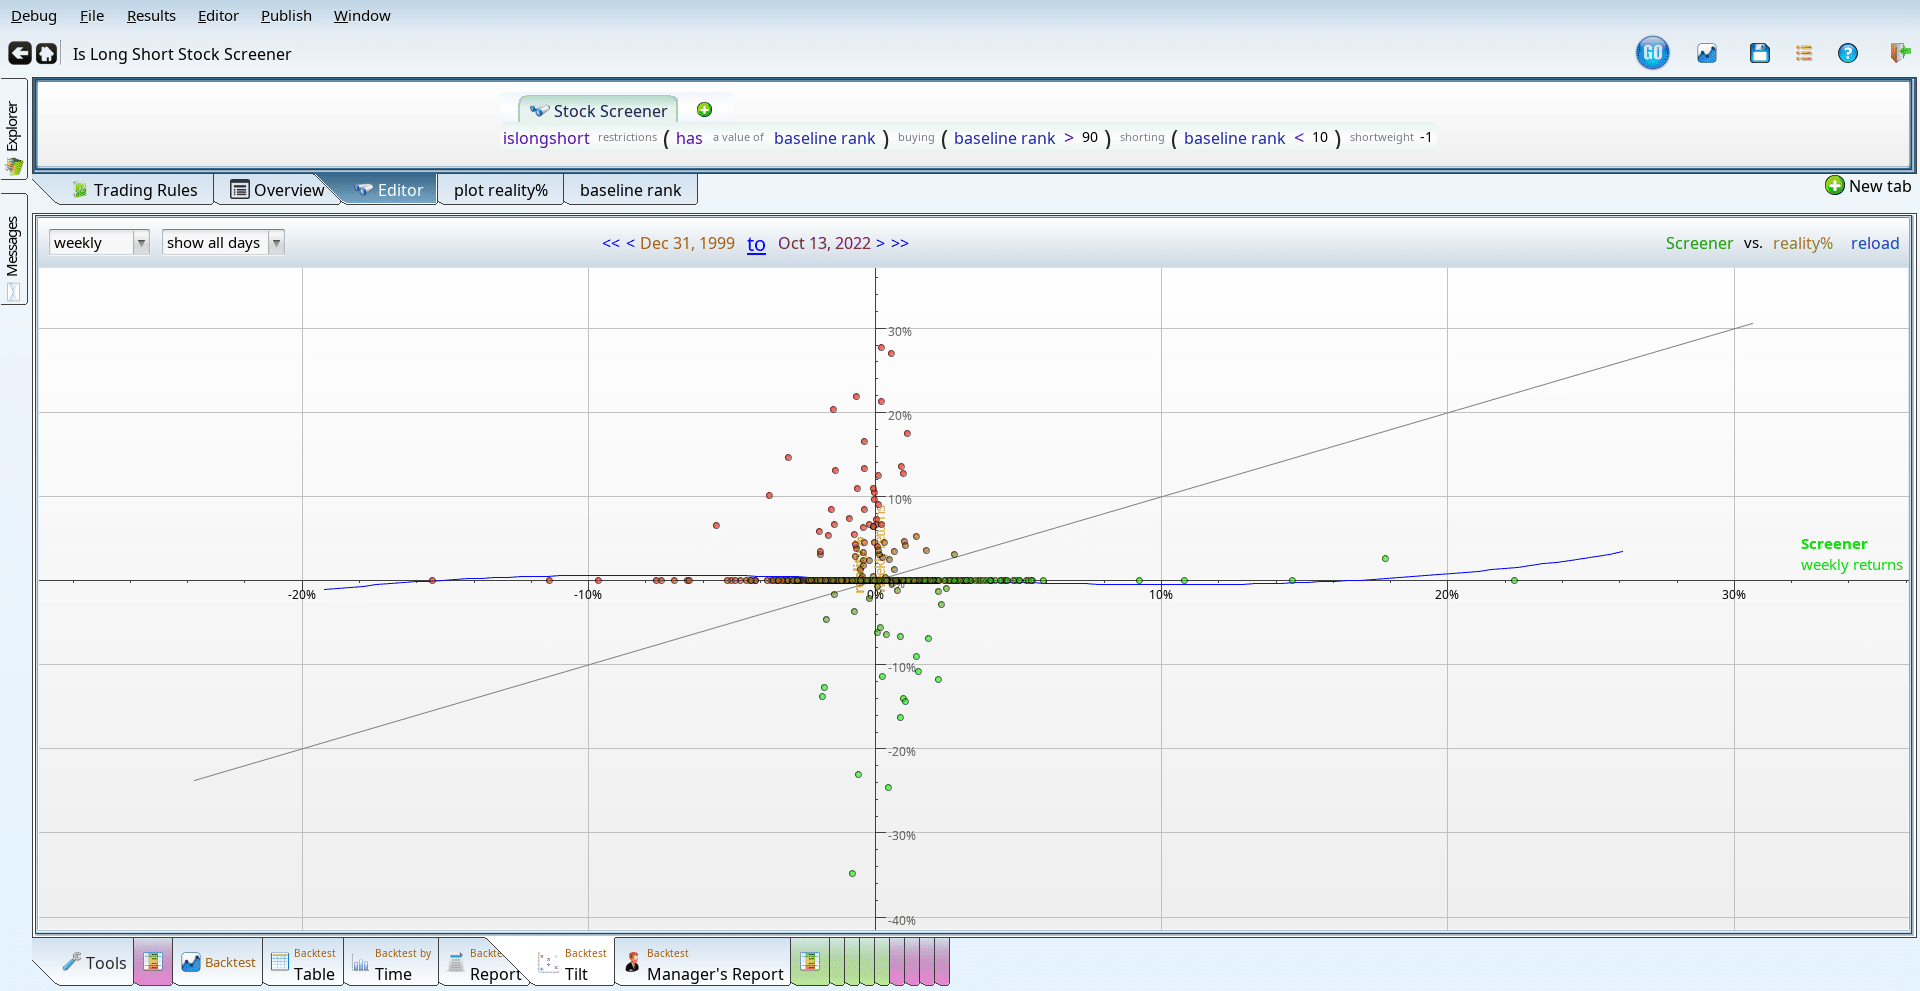
The backtest tilt in this case shows an alternative view of a long/short portfolio. The large number of points clustered around the y-axis indicates that the strategy made a bold move, up or down, when the market went nowhere.
The dots around the x-axis tell a tale of drifting while the market was strongly in motion. As with many long/short strategies, market correlation is almost absent: beta is 0.007, which allows this strategy to have 2.25% alpha even while only going up half as much as the market.
Max holdings
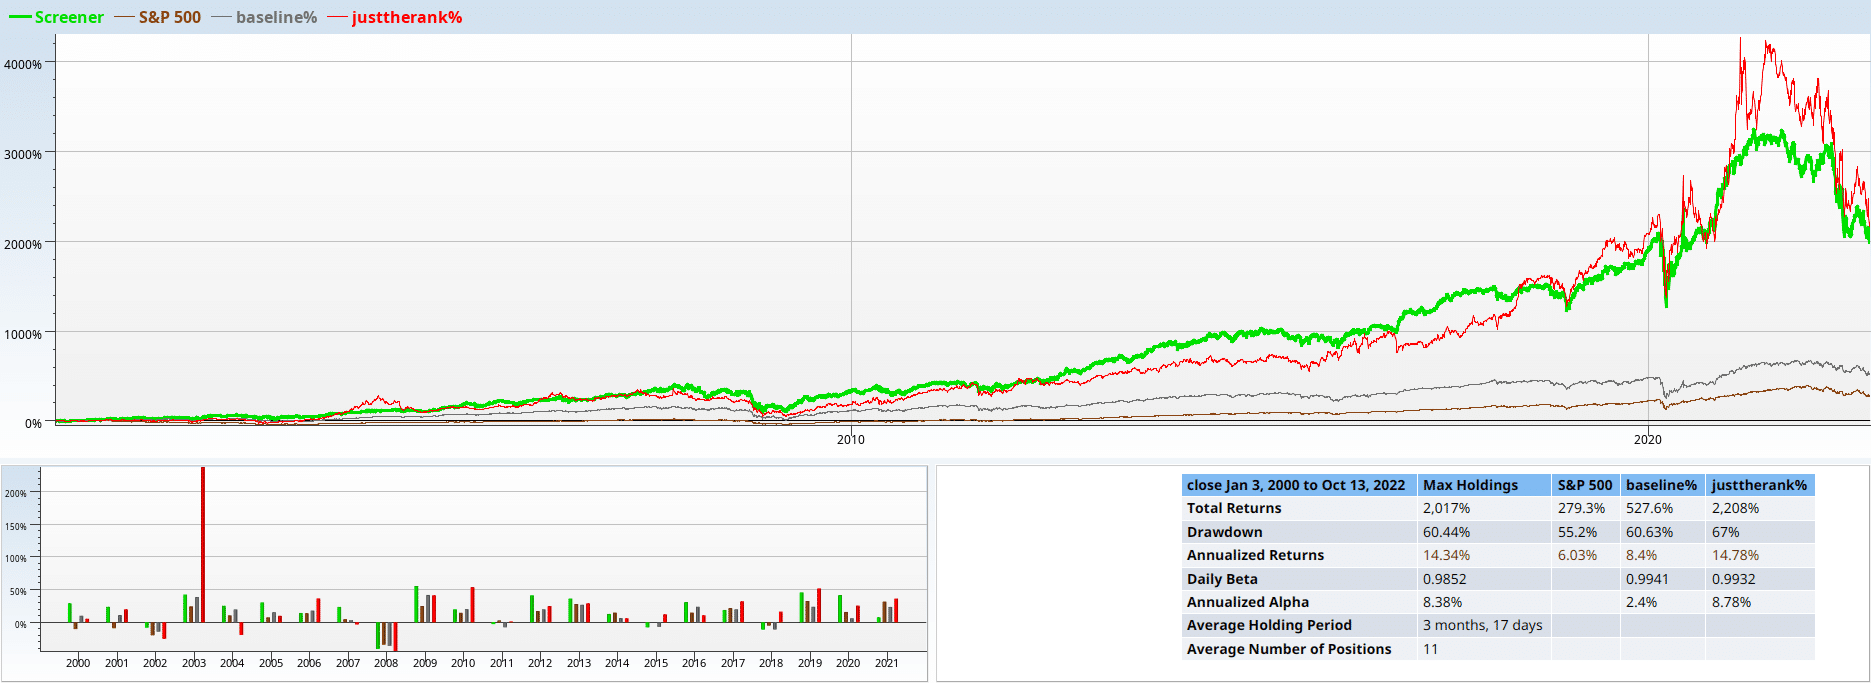
Think your portfolio is too big? Limit the number of stocks held. Here, max holdings has been set to 5, with the ranking factor being Income Statement Score – Balance Sheet Score.