Supposedly Boring Dividend Screener

The goal of this screener is to find low volatility companies that are paying exceptionally high dividends, and are able to afford paying these dividends to their shareholders.
- The company must give dividends
- The company must have been able to afford every dividend they’ve given.
- The dollar amount of the dividend must have increased by at least 5% over the past year
- The dividend yield must be ranked in the top 80% of yields within each SIC sector
- The market cap of the company must be over $2 billion
- The company must have had fewer 10% changes within the last three months than 50% of the market with a market cap over $2 billion.
- The company must have a value score greater than 3.
What kind of Companies are Returned by This Screener?
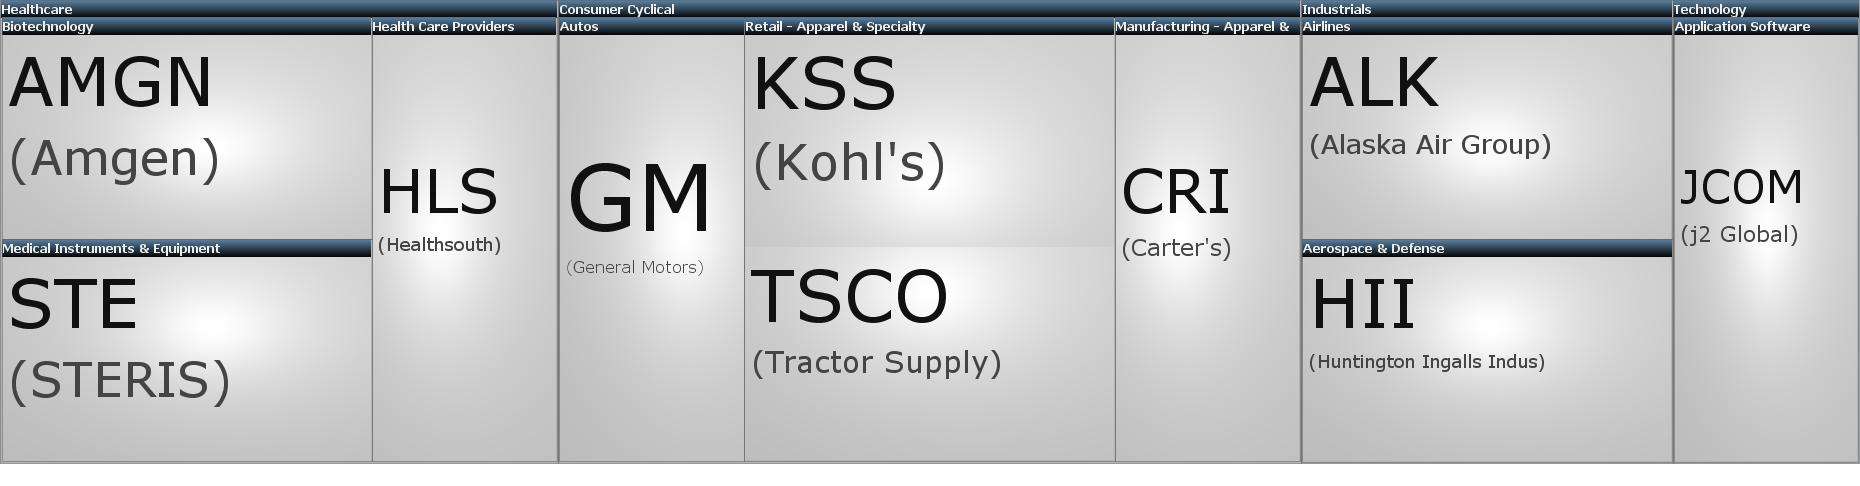
On average this screener returns anywhere for 5-10 stocks. This isn’t a lot of different investment opportunities to choose from, but what is here allows for a well-balanced, diversified portfolio.
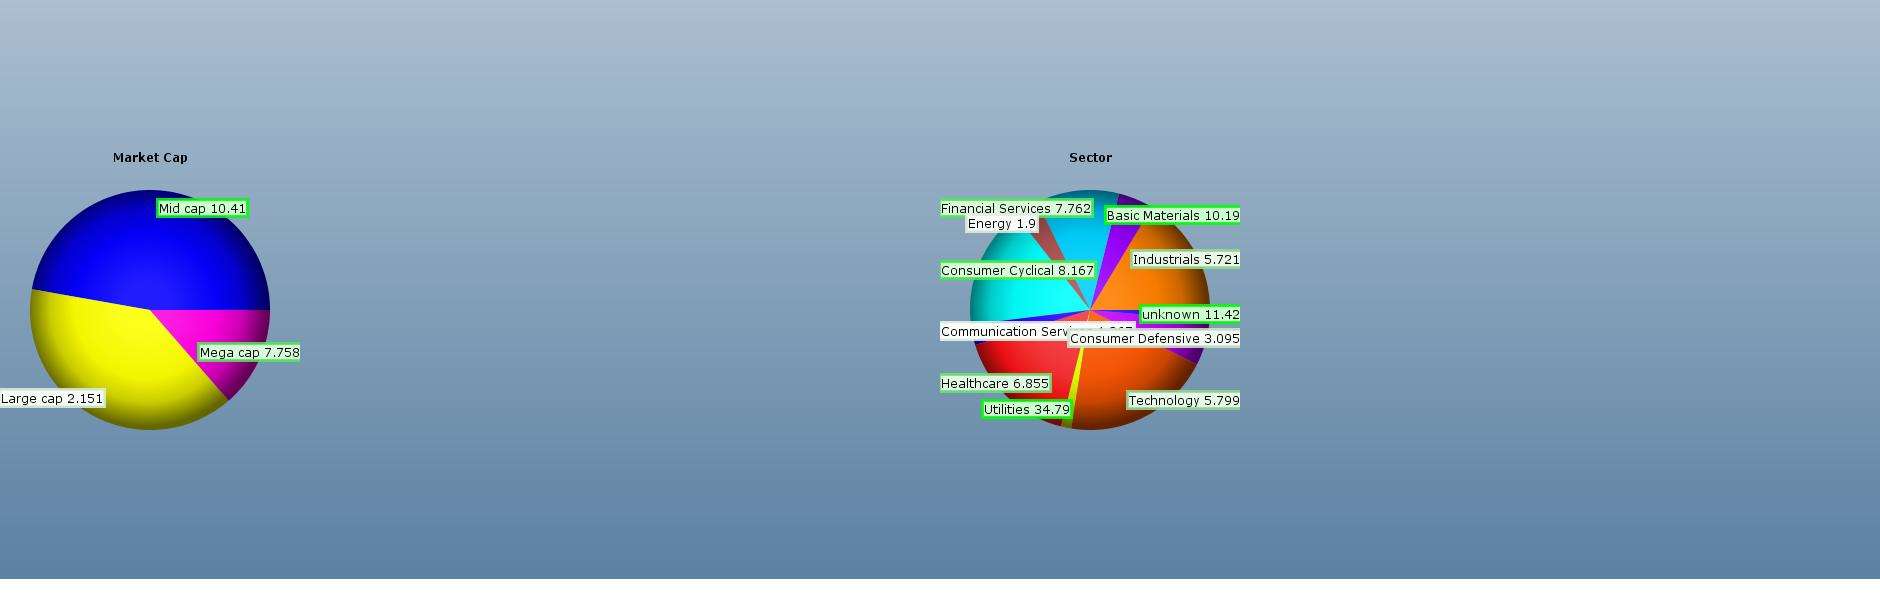
As you can see, this strategy doesn’t put “all of its eggs into one basket” as throughout the past twenty years it has evenly spread investments across most every industry.
And How Does this Strategy Fair Since 2000?
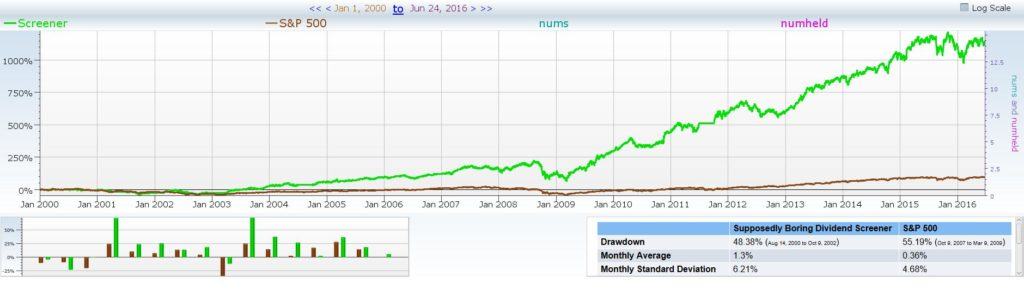
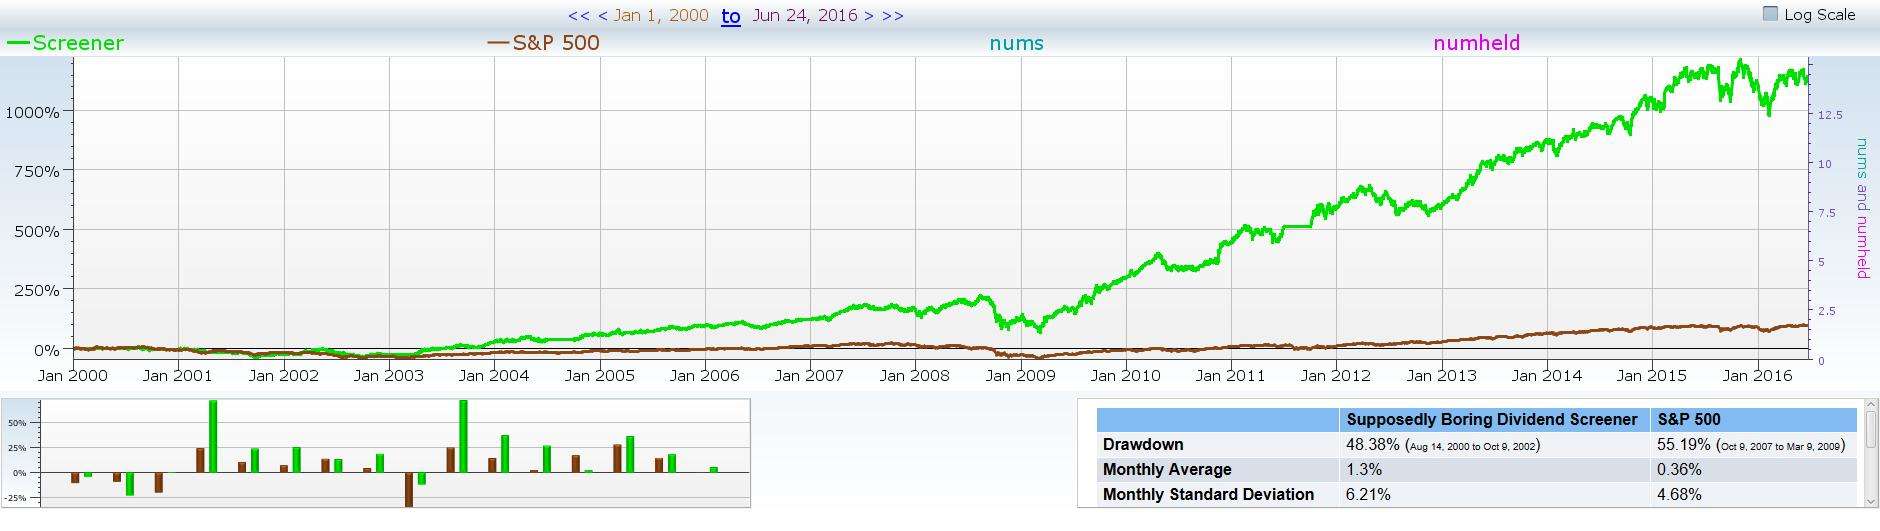
Backtesting the strategy over the past 16 years we can see that it has beat the S&P by a significant amount – returning an average of 1.42% monthly compared to the S&P’s 0.36%. This resulted in a total return of over 1,300%, or almost 18% annually. These results include both trading costs and dividends being reinvested as we go along.
A few other things to notice:
- Lower drawdown than the overall market
- The strategy has a monthly standard deviation that is only 2% higher than the S&P
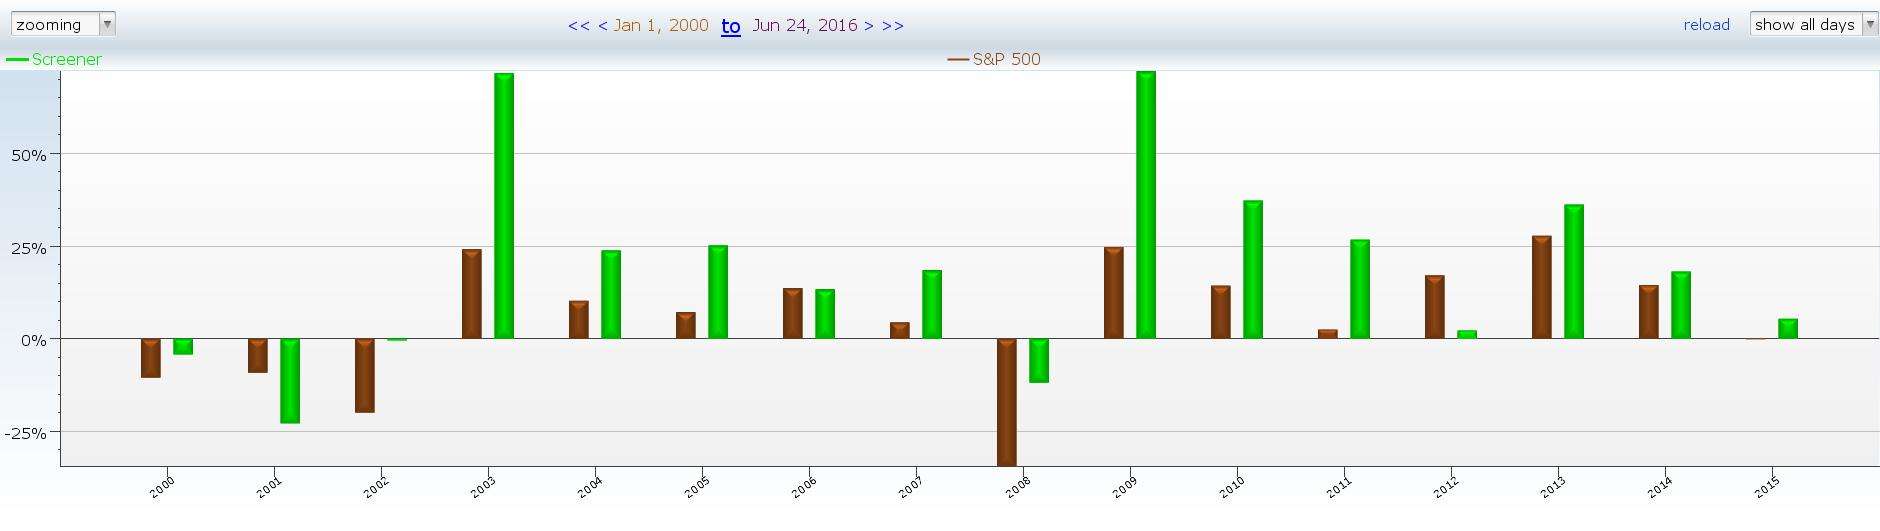
- The strategy exhibits consistent growth only losing money three other the 16 years we backtested.
Since the S&P isn’t the best benchmark to use when looking for a long term dividend based investment strategy we went ahead and plotted the backtest of every stock that gives a dividend in comparison to our screener.
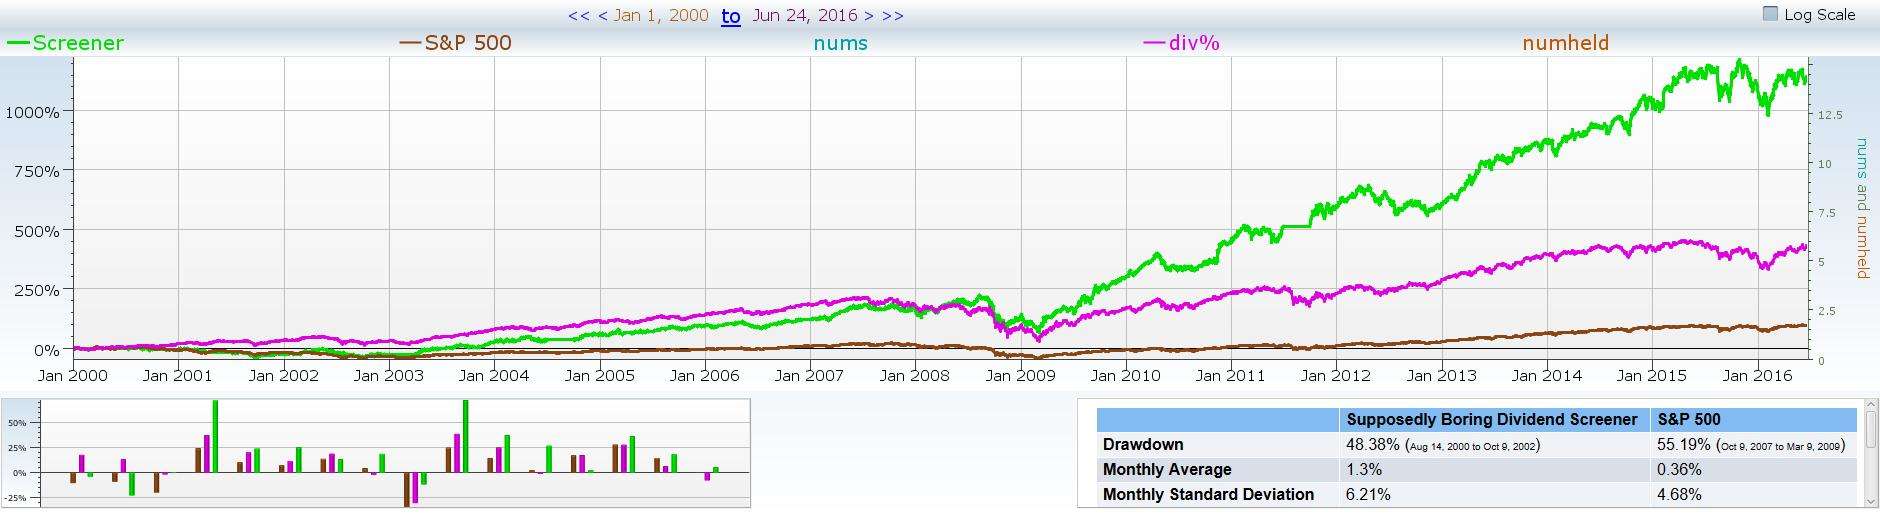
Over the past 16 years a portfolio with every dividend stock in the market would have only averaged 10.43% annually for a total return of 411%.
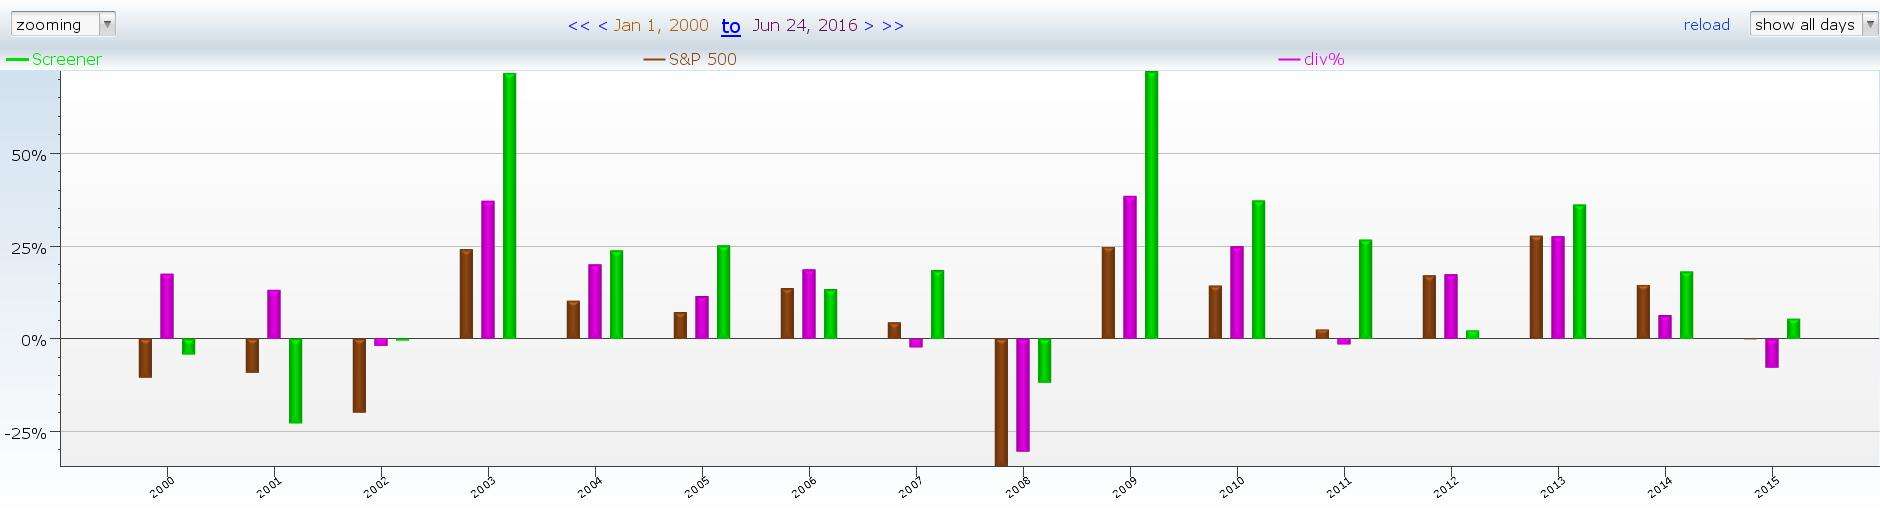
Though the pool of all dividend companies beat our strategy in the early years our strategy has consistently beat both the overall market and the pool of dividend companies – making more money in up years, and losing less money in down years.
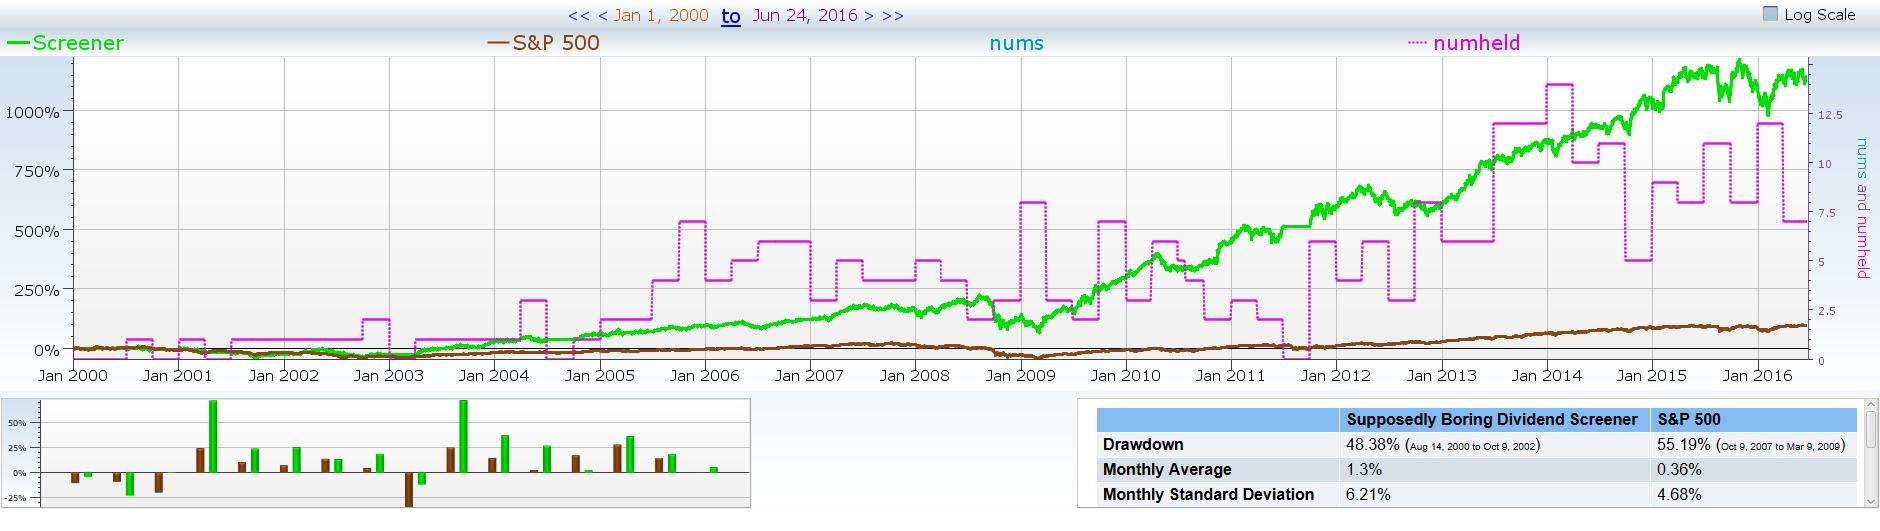
Since 2000 you would have made a total of 285 trades. This cuts down on trading costs and commissions and allows you to capture more value from your investments. This strategy consistently presents 5-10 different positions for you to enter into each quarter, cutting down on risk and trading costs.
Overall
After going through the validation process on this screen I have personally fell in love with it. I was excited to feature it within our system and write this article, and now I am excited to implement this into the dividend side of my portfolio. Happy investing!
Standardized Validation Suite Passed by the Screener:
- Beat the S&P 500 over the past year
- Held more than 40 stocks in a ten year period
- 64% success rate
- Passed Long term rebalance criteria, but failed short term rebalances
- Backtest is better than, but mirrors similar strategies such as a pool of all dividend stocks
- Screen performs well with different maximum holdings
- Screen does better than the overall market even if you eliminate its best year
- Backtest includes trading costs and succeeds
- Screen does not focus on any one specific industry or company