


Tiny Titans: A Brief History
After he published his book in 2006, James O’Shaughnessy became a household name in financial circles. In particular, he is known for creating the “Tiny Titans” stock screener, an algorithm which has become celebrated for delivering extremely high returns, albeit somewhat volatile ones.
O’Shaughnessy’s screen focuses on low-cost tickers with small market caps. His reasoning goes that, as small as these companies are, most analysts ignore them in their investigations, and large, well-known mutual funds are unable to buy shares without subsequently altering the price. This lack of attention suggests that there quite a few diamonds in the rough within microcap stocks. These have the potential to yield astronomical returns in the future. O’Shaughnessy also notes that these micro stocks often have little correlation with the greater market. This allows them to act as a hedge in a greater investment strategy. Specifically, Tiny Titans filters for these criteria:
- The market cap must be between 25 and 250 million.
- The Price to Sales ratio must be less than one.
- When describing the universe of liquid stocks, the minimum traded per day is $500,000.
- Only the top 25 stocks in price appreciation are purchased.
Results since 2000

If we only backtest microcap stocks and megacap stocks (no P/S or sort applied), we can see that O’Shaughnessy’s methodology is essentially correct. Stocks with a market cap between 25 and 250 million consistently outperform stocks with a cap greater than 100 billion (but not the S&P). However, these micro stocks are also far more volatile. This backtest has a range of over 1100% (100% loss to a 1000% gain) over its run period. The filtered Tiny Titans is slightly more stable, but still returns a chart with mountains and valleys sharp enough to make even the most unorthodox of investors go shopping for a pacemaker.

Propping Up the Giant
Looking at this graph, we can see that Tiny Titans ceases to be a whirlwind of success from 2010 to 2020. This has led to a number of outlets publishing their own takes on O’Shaughnessy’s screener. They tweak one criterion or another in an effort to “fix” the strategy, and continue bringing back those high returns. One of the simplest modifications done on Tiny Titans is simply to rebalance more often. Instead of the leisurely quarterly rebalance in the canonical screener, others set their screener to re-evaluate monthly, or even weekly.

The pink in this graph represents the screen rebalanced monthly, and the charcoal rebalanced weekly. The results for each are rather consistent: rebalancing monthly nets you higher, but more volatile gains than the standard quarterly, while weekly provides a smaller, milder return.
Raw Close and Other Tweaks

Another common refinement (for this and other screeners) is to remove stocks with a low closing price. At first glance, this seems understandably counter-intuitive: why add a filter that so consistently underperforms the original screener?
There are a number of reasons that require us to invoke this strategy. The first lies in relative gains contrasting with absolute gains. A penny stock purchased at 10 cents, even with a gratuitous return of 1000%, only yields a single dollar–a value not material to most investors. Additionally, their low prices and trade volumes make penny stocks more vulnerable to manipulation. It’s comparatively easy for an aspiring swindler to generate false interest in the stock, only to sell the shares he holds at the inflated prices before they come crashing back down to reality. Neither of these qualities are desirable to investors, so it’s only sensible to avoid penny stocks. To that end, all of our subsequent refinements will be on those stocks with RawClose>3.
Refining with Piotroski
We can also refine O’Shaughnessy’s screen by using it in tandem with another basic screen. In this example, we use the Piotroski score to refine Tiny Titans further, filtering out those tickers that scored less than 6:

At first glance, we seem to have struck gold–a return of over 10,000%. However, if something looks too good to be true, it’s best to assume that it is. 2013 is when the Piotroski screener began to rise in earnest; let’s take a closer look at the holdings in that time period.
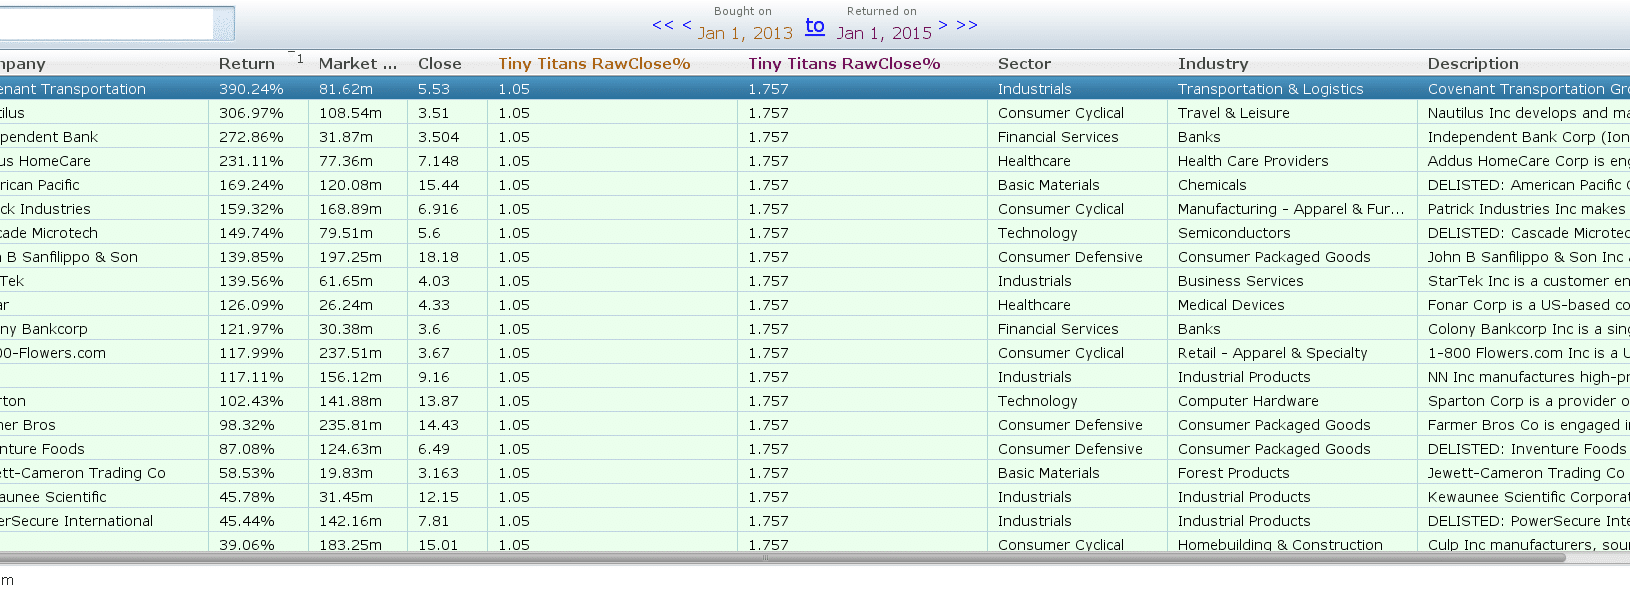
While there are a few clear outperformers, these tickers aren’t so far ahead of the pack as to be called outliers. It doesn’t appear then that we owe our success to one or two fluke investments. What if we ignore the entire years of 2013 and 2014 entirely? These were by far the best-performing years, perhaps the algorithm just got lucky in that brief period.

The gain isn’t quite as dramatic as before, the screen still brings a return of over 4,000%. Even with the best years removed, our screener leaves both the S&P and the vanilla O’Shaughnessy in the dust. It would seem that we’ve exhausted our repository of ‘sanity checks’ on this screener. Even after correcting for the raw close price and removing any possible outliers, we still see very good performance from this screener. Finding the reason for this, and whether this performance can be expected in the future, is left as an exercise for the reader.