Fundamental Stock Screening
Point in Time Backtesting
Who are you?
You clearly want a way to rationally buy (and sell) stocks. You know that making trading decisions in haste leads to plenty of time to repent later. You want a system to refine, that makes it easy to buy the right stocks when the market is open, and you are trading. The hard work of refining the system comes when you have stepped away from the market, and find it easier to think rationally. You might be any of:
- Someone who invests for their own account. Maybe you had really powerful tools when you worked in finance. Maybe you didn’t. Either way, you want something more surgical than a few pull down boxes at Finviz.com. You’d also like to test your system before you go live.
- Someone who trades for other people. A family office, a financial advisor, a portfolio manager, or someone else who’s job depends on making good calls. You probably don’t have time to go into the weeds, but you know what you want to try, and just wish you had someone to help, and a tool that could implement the core of your system, and tell you whether it has legs. Iterating quickly and coming up with something amazing would be a bonus.
- Someone who teaches classes on how to invest. You can lecture all you want about Fama-French, and the five factor model, and the anomalies, but you know that that’s not the same as investing. You also know that making students pick stocks at random, based on who they’ve heard of will make them wiser, but won’t prepare them for working in finance. You want a better way.
Who are we?
We are a small business that aims to make investing more comprehensible. We can’t explain Gamestop, but we can figure out some of the things that the stock market does on a semi-regular basis. We know that valuation matters — within certain limits. We know that bad momentum can tank your investments, but that you probably can’t create a winning strategy on momentum alone.
By learning the patterns, and systems that lead to good investments, we improve in our investment skill day by day. We also aim to not repeat the same mistake too many times. Part of avoiding that is done by making an investment system. When I (Henry) am faced with the market, and the temptation to make bad decisions, I simply trade my system. When I need to think hard about how my system could be better, I am not looking at the market. That divide prevents many unforces errors.
We have created a way to manage, improve, and use systems to make investment more repeatable, and more doable. This also makes it more fun.
How does it work?
To create a good investment system, you start with an idea, that might look something like:
- Undervalued stocks outperform
- Stocks of growing companies do better
- Cheap, growing companies do better
- Safe companies do better than risky ones
- Dividend payers are better investments
- Companies in hot sectors outperform
- Companies that have done well will continue doing well
Armed with an idea, you then test the idea. Faced with the results, you see how it failed, and make it better. Once you are happy with it, you make a watchlist. A watchlist helps you maintain a portfolio of stocks which match. These portfolios need to be updated at regular intervals. This is, as you might guess, something that gets tested.
The market changes its mind about what it likes from time to time. Unfortunately, for us, it does not typically give notice when the rules change. You’ll notice when one of your systems stops working as well as it used to. You’ll have to figure out how to react, and how to change your system. You may want to have several systems, so you diversify your systems risk. This simply means having multiple screens, and multiple watch lists.
If you want to simulate your trading activity before going live, we have portfolios, which can accept “trades”. There are a few differences:
- No day trading. Since we don’t handle ideas that require intra-day trading, we don’t simulate the same stock being traded more than once per day.
- Stocks and ETF’s only. Since we only handle ideas that cover stocks and ETF’s, we only simulate stocks and ETF’s
How do you find Stocks to Buy?
A system is, at its heart, a stock screener. A stock screener is simply a formula that is true for some stocks, and not others. These formulas can use any of:
You can combine multiple parts together, and create ranks, scores, and more. We aim to make easy things reasonably easy, and very hard things reasonably doable.
Can you trust your results?
Our data comes from Morningstar, with macroeconomic data from FRED (The Federal Reserve of St. Louis). Our data goes back more than 20 years, including 18,000 companies, and covers the income statement, balance sheet, cash flow statement, and price history.
We cover data from “Accounts Payable” through “Non-Current Deferred Assets” to “Write Offs”. We also include “Market Cap”, Close, Volume, and PE in our hundreds of properties.
We also work hard to avoid biases, so that our simulations and systems are more likely to mostly work in the real world. This means:
- We keep old, defunct companies. Purging defunct companies or funds from your dataset leads to survivorship bias. This bias makes mutual funds look much, much better than they are. Having this bias would render your results worthless, so we take pains to avoid it.
- We lag the data to reflect the time it was available to the market. The annual earnings for the period ending December 31 certainly did not come out on New Years’ Eve! They probably came out sometime in March. Even after they got to the SEC, you probably didn’t have it in your tools/datafeed until a few days later. That delay matters, and neglecting it makes it easy to create strategies that work only in theory. We prefer to take that into account, to give you more useful results.
- We use a configurable filter to filter out companies that are very hard to invest in. This filter ensures that you simulate strategies using only companies you could actually invest in — without buying the whole company!
- We constantly seek out new biases, so we can excise them from our results. If you see any we have missed, or wonder if we handle a given situation, just email us at support@equitieslab.com, and we will answer promptly.
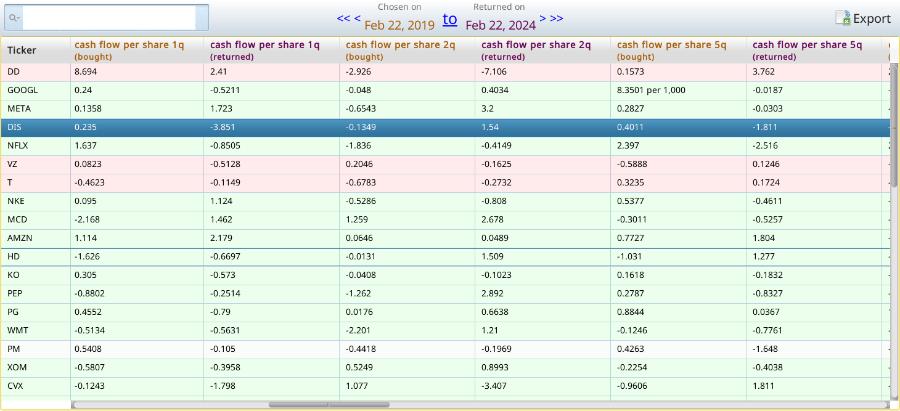
Can you test your idea?
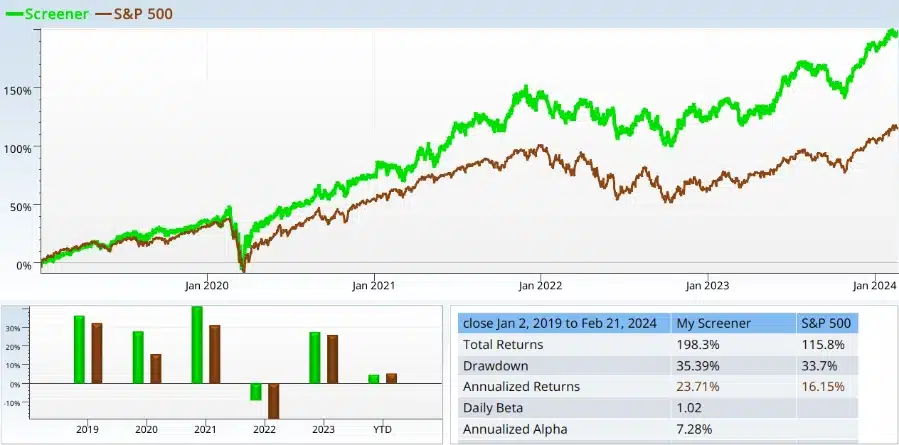
Use our complete financials on 18,000 stocks covering the Use the company financials to see how companies stack up on academically proven fundamental scores — or roll your own. Having done that, you can evaluate your strategies, understand how well they work, tweak them, and blend them with other strategies to get the best results. Since the formulas are clear, they are easy to explain to your future self, your investment committee, or your class. 20 years to validate your strategies– worry-free. Our data comes from Morningstar, with macroeconomic data from Quand.
You’ll see the fundamentals that lead to your alpha, and be able to tell its source at a glance. Why stop there? You have Equities Lab, so you can always dig deeper. Maybe you’ll want to tinker with the rebalance period, altering it to quarterly, monthly, or biweekly on a whim. Perhaps stop losses, minimum holding periods, and other sanity checks are tools you wish to attach to your investment plan. You can see how your strategy would have done, what it bought, how each position did, and more. You can’t exactly backtest real life in Equities Lab, but you can come close.
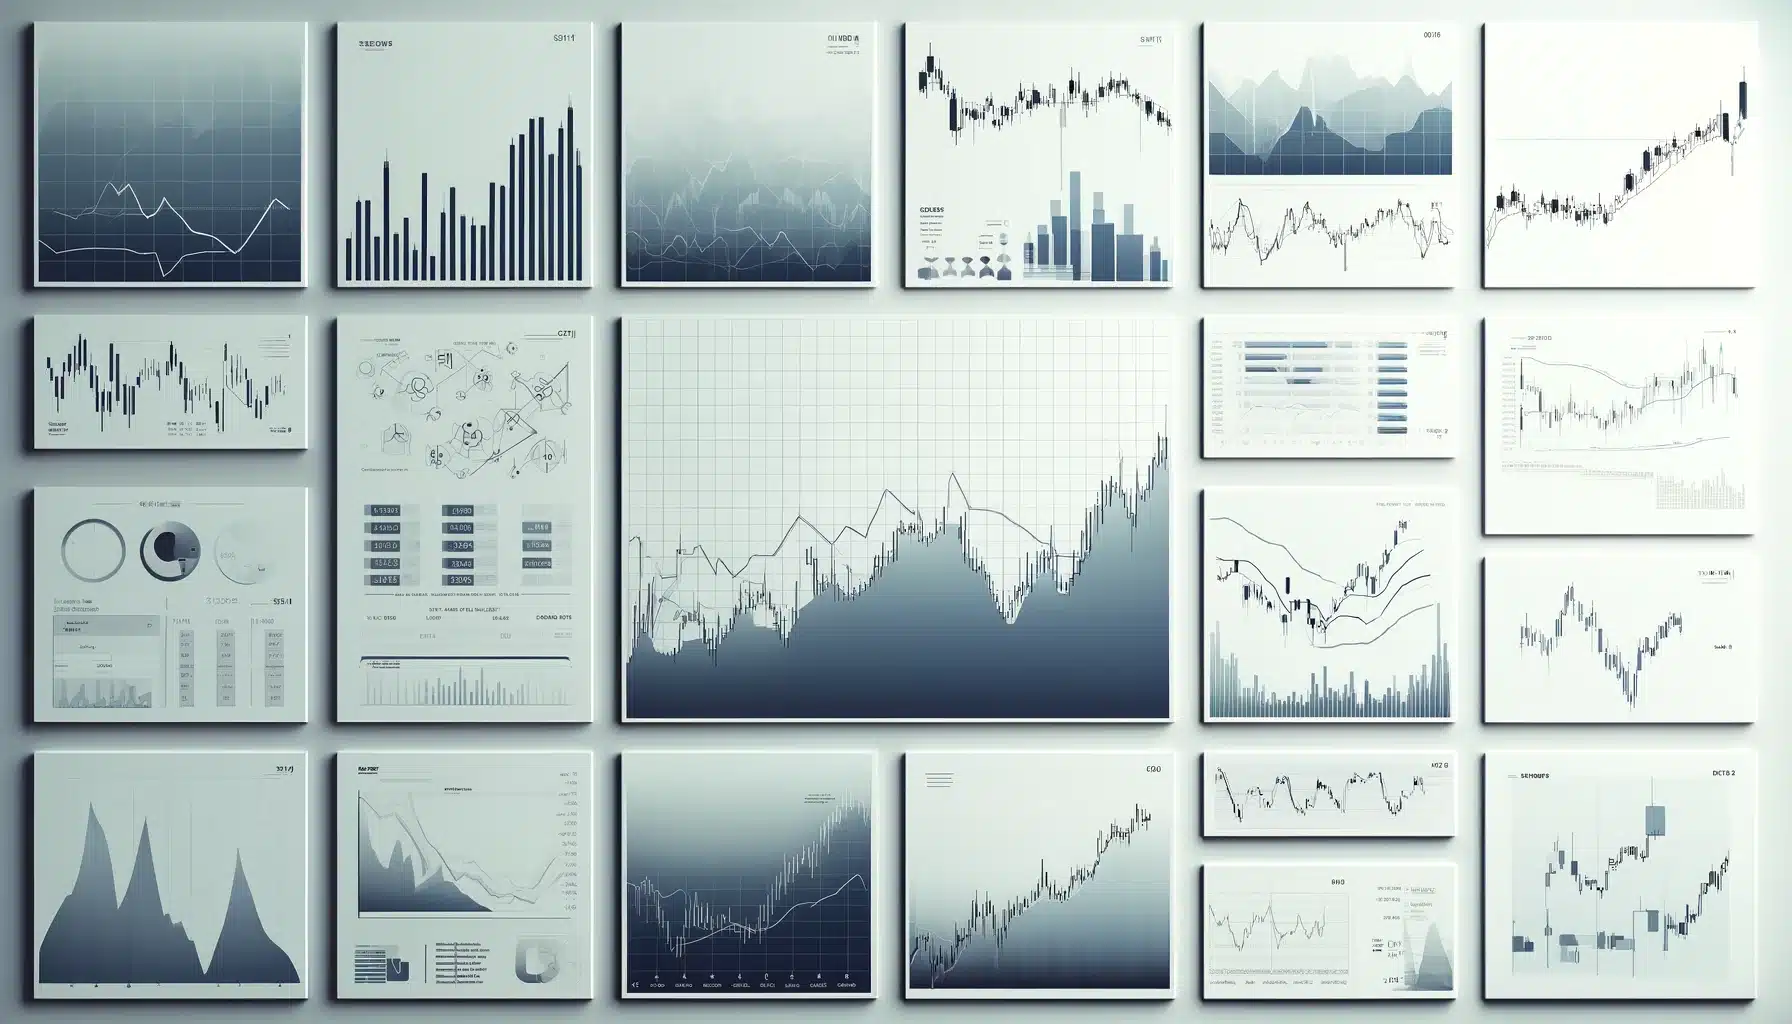
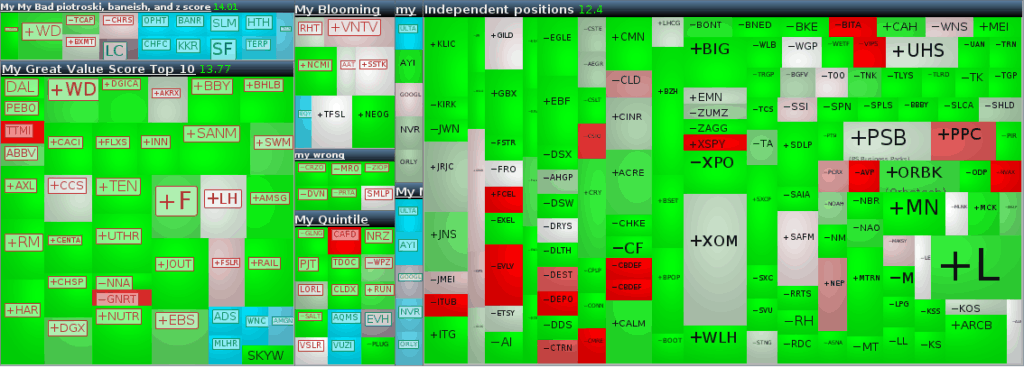
What is everything else doing?
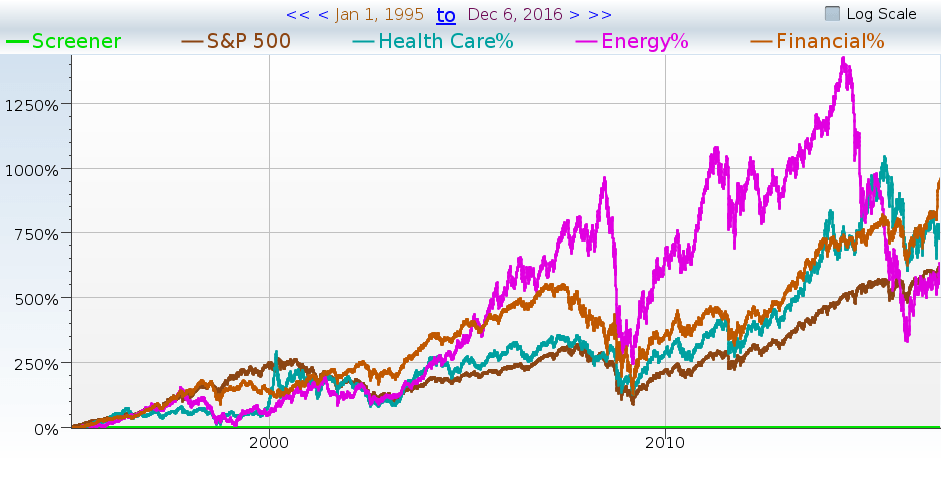
Investing in the stock market requires big data, which we have. We can summarize the state of the entire market in a few clear lines, in a few seconds. We can focus in on a sub sector, or a slice based on company size, or analyze one of the P/E quintiles in more detail. If you want to know whether highly leveraged companies are overvalued versus their historica average, or whether airlines are outperforming small cap technology, you can see it on a handy chart.
What really matters for Investment?
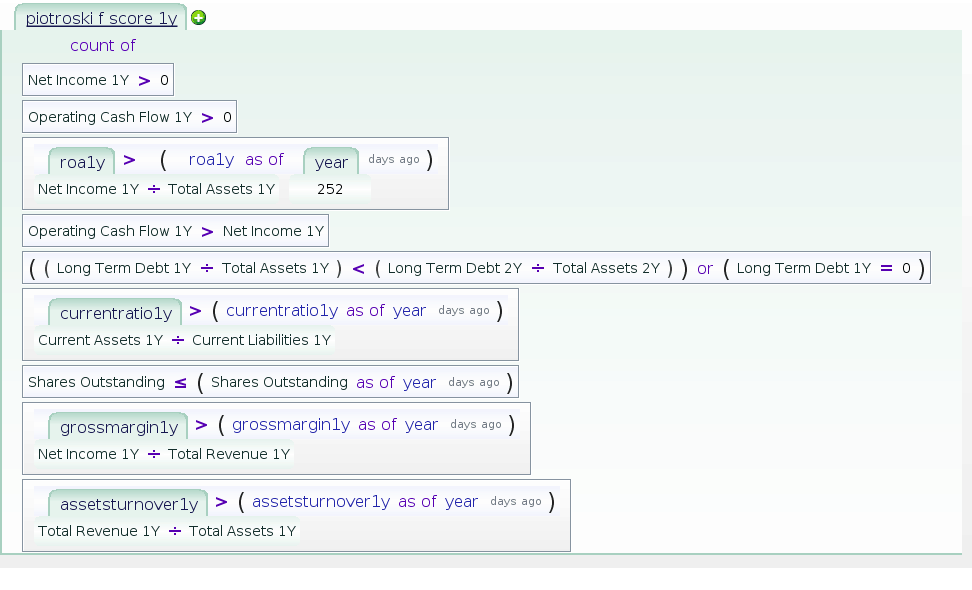
Structure your formulas and ideas any way you want. You can test almost any financial anomaly with Equities Lab and see if it generates excess return. We can easily express any of the Fama French factors, see how Quality Minus Junk works, or create and validate your own anomaly. You get autocompletion, a helpful field and operator reference, and built-in help every step of the way. For instance, people like to use the Piotroski score to filter stocks. Piotroski score is a nine-point checklist, and a good Piotroski stock would have to match seven of these nine conditions.
Checking Piotroski score in Equities Lab is simple to do: it takes ten statements– nine for the condition, and one for the count and comparison. Similarly, finding the stocks that are the second-cheapest 10% of some valuation metric is painless. If you want to filter companies before you rank, and if you want to collate by industry or other segment, you just do it. It is literally easier to do than to describe. Here are the ten statements (we just took a screen grab of our built-in formula).