
From Instinct to Evidence
At Equities Lab, we believe that a robust strategy is the key to investment success, and our mission is to empower every aspect of your investment process with our advanced tools and comprehensive data.
Whether you’re a quantitative analyst, a university professor, or an individual investor, Equities Lab provides the tools you need to explore, test, and optimize your investment ideas. From point-in-time backtesting, portfolio simulation, and charting Equities Lab allows you to make well informed decisions easily.
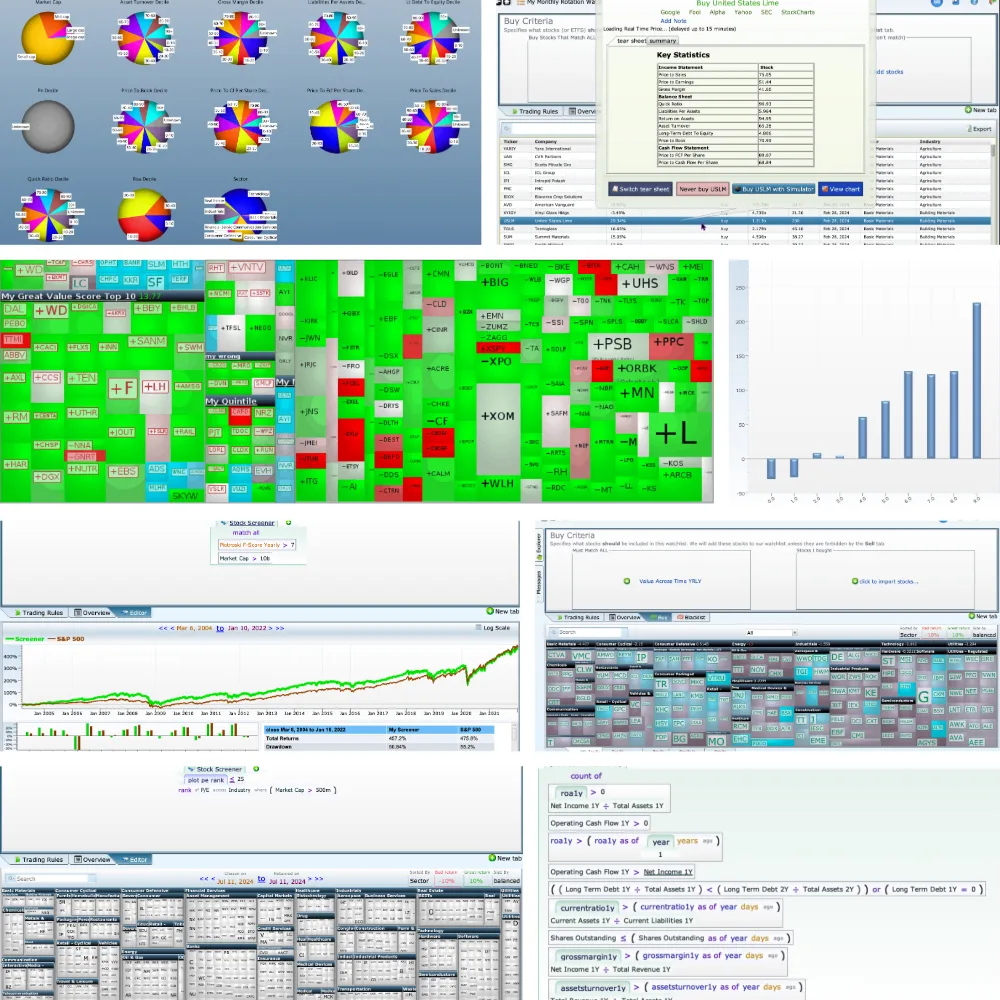
FIND STOCKS
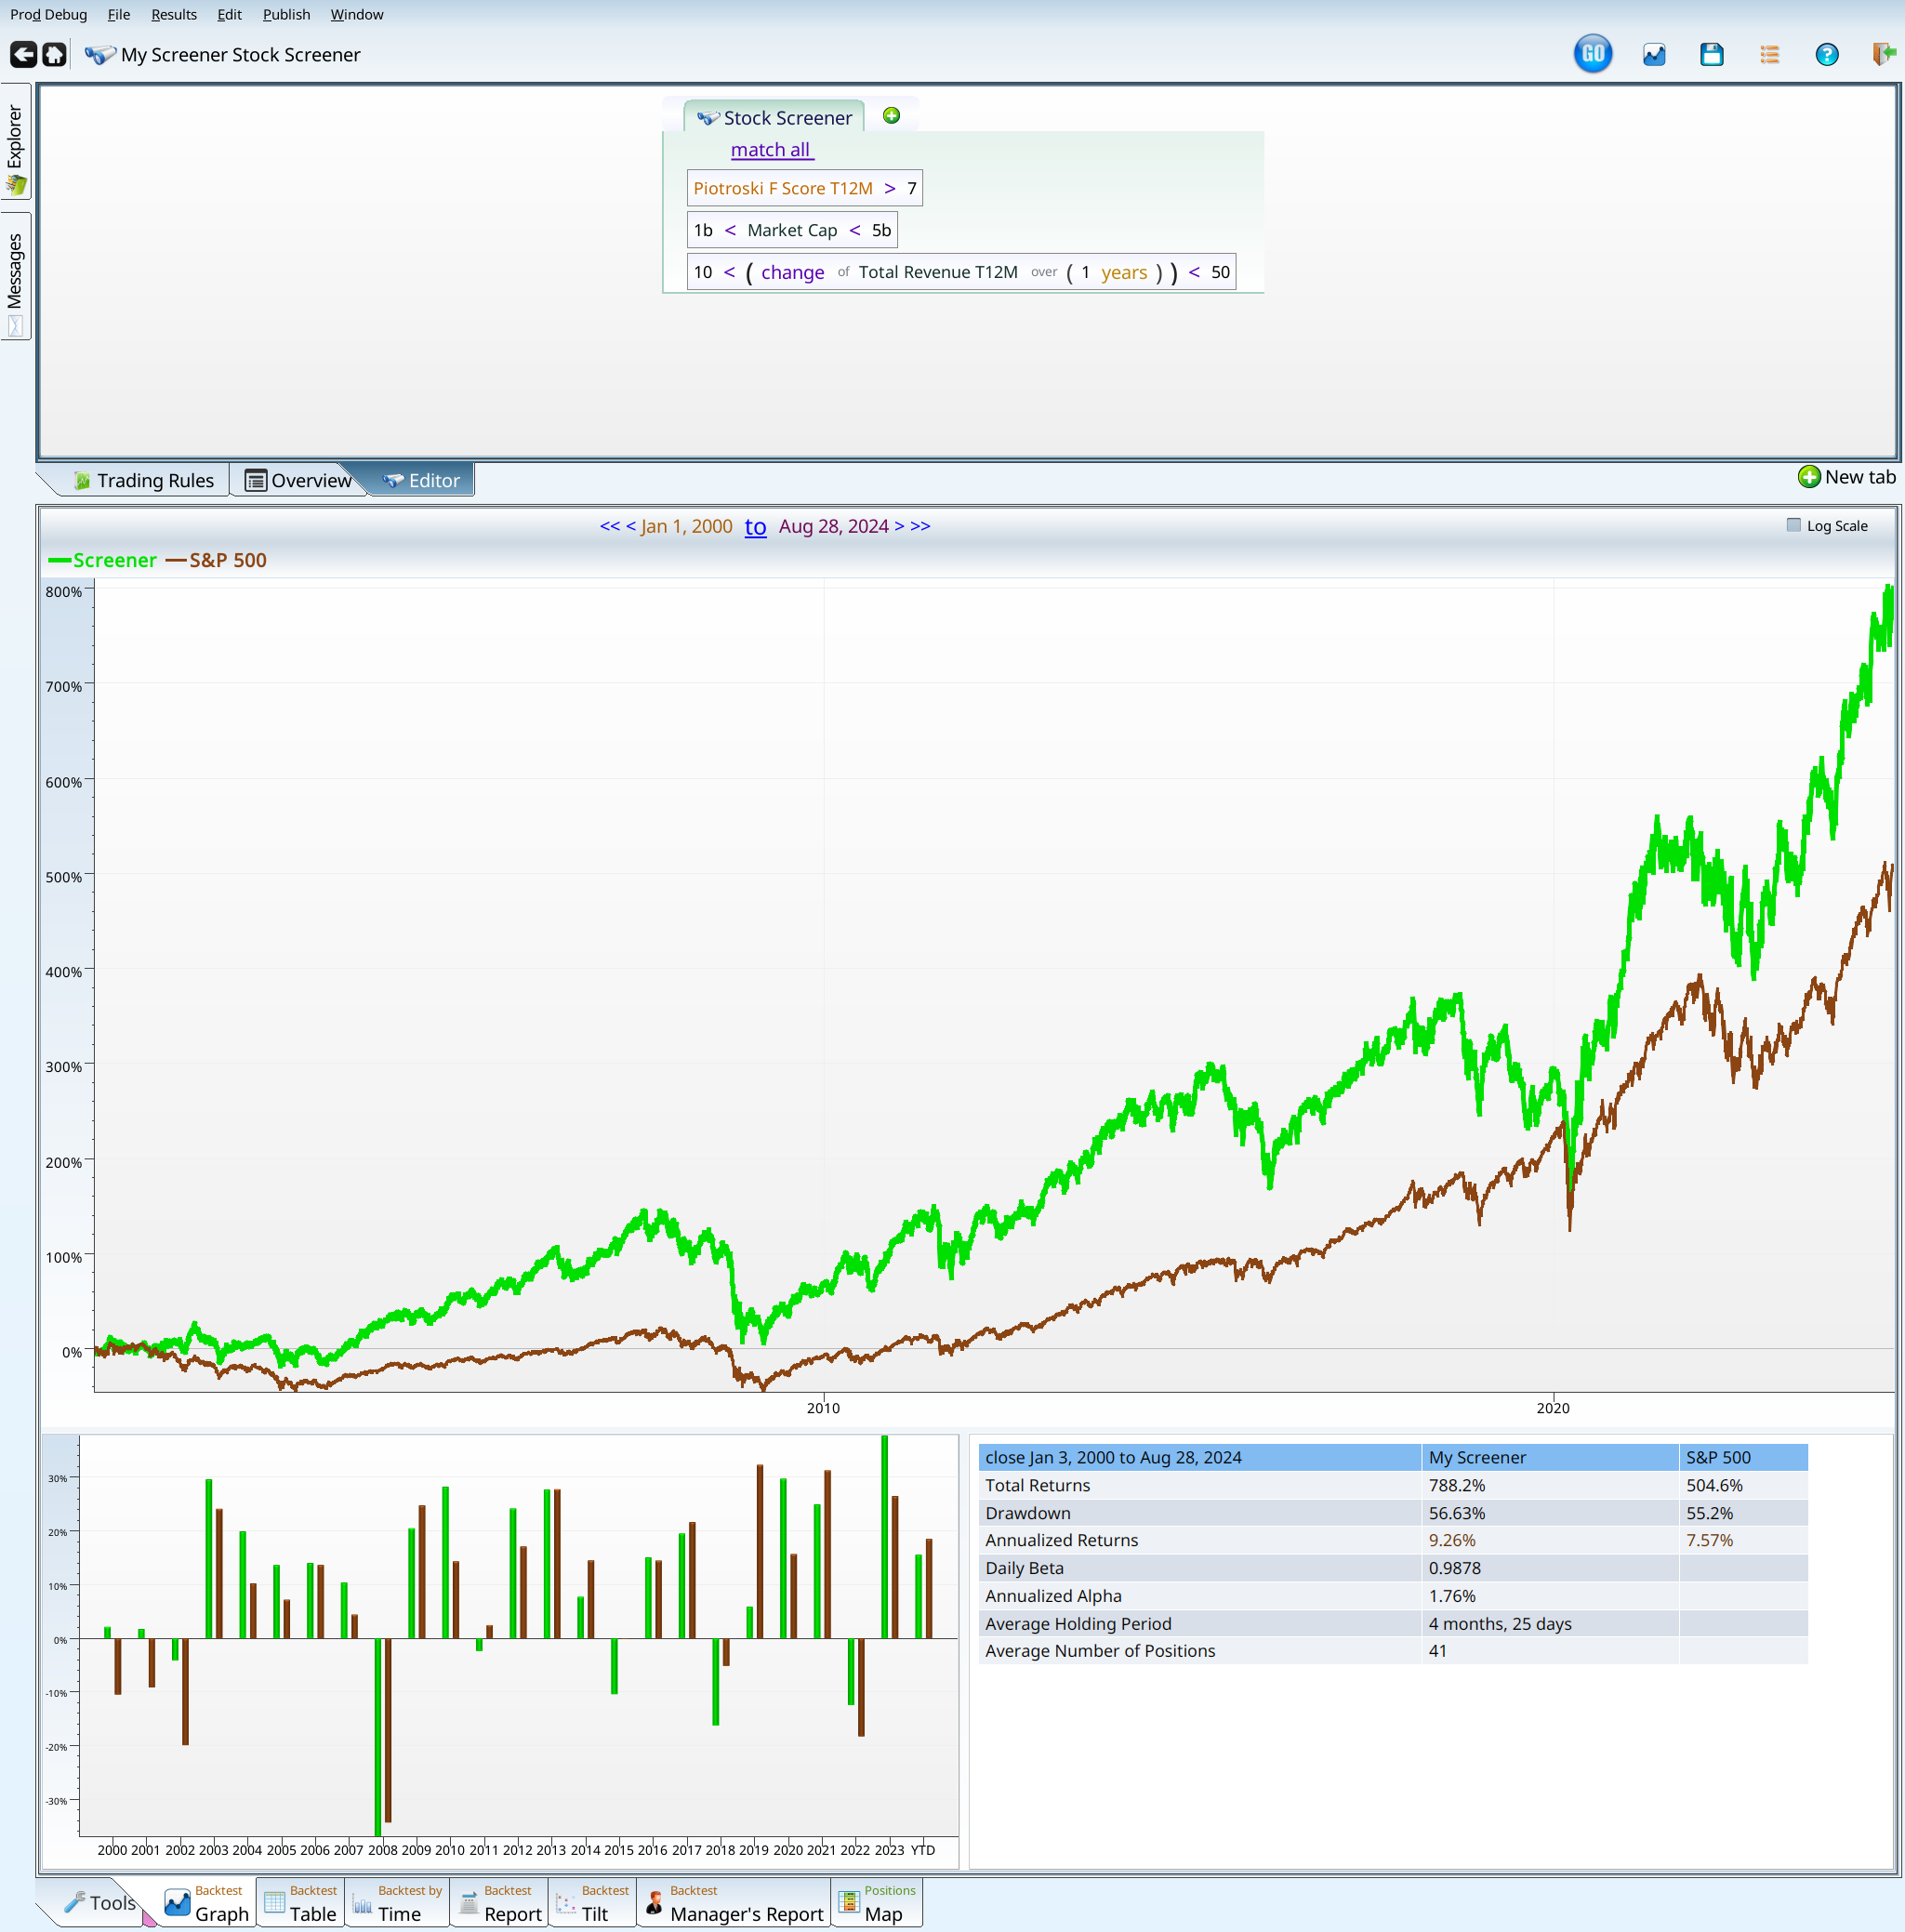
Our powerful stock screener allows you to filter through thousands of data fields, enabling you to identify stocks that meet your specific criteria. With advanced operators, you can perform nuanced comparisons, such as evaluating whether a stock’s P/E ratio is lower than 75% of its industry peers, providing deeper insights than simple metrics.
BACKTEST
With Equities Lab, you can test complex setups that incorporate a wide range of financial metrics and academic scores. Our point-in-time data and lagged information help you avoid biases and provide a realistic assessment of your strategy’s performance. This comprehensive backtesting tool enables you to uncover promising investment opportunities and optimize your portfolio with confidence.
COURSES
Our courses delve into everything from fundamental financial concepts to advanced quantitative analysis, including a variety of investment anomalies. With auto-graded assignments, learners can engage material more fully and have fun. Prefer technicals, financials, or macro factors? We do it all!
-

Joshua Bannon
– Software developer
“I first tried out several other analysis products including eTrade Pro, NinjaTrader and attempting to cobble something together with Google Finance and Google Spreadsheets.The other options were pretty terrible and your product seems almost exactly what I want although, there have been a couple of quirks for me so far: All in all, this is very well done. I haven’t used it much yet, but I already mentioned you to a friend at work who I know is very interested in the market.“
-

Ian Unsworth
– Student
“While it does at first seem intimidating, after watching the four quick start YouTube videos provided on the welcome page, I was quickly able to get a working understanding of the software and all the insight it had to offer. Overall I’d have to say Equities Lab surprised me with the extensive amount of analytical tools it has to offer paired with the sophistication of very smooth running software. The software is perfect for both those with market experience, as well as students who are“
-

Bradley Hills
– Student
“As a finance student, I have had multiple classes that have used the Equities Lab software for projects, and I have really enjoyed working with it. The back testing and portfolio construction capabilities have been especially useful in developing my understanding of quantitative finance. Additionally, the Equities Lab team has been incredibly helpful and kind whenever I have reached out to them with a question. In particular, I had a project that involved some complex stock screeners and I“
-

Eric Darnel
– Investor
“This software is very impressive with its ability to test portfolio strategy performance over time. It has enabled me to optimize screening and management strategies while giving me confidence in long term expectation of return and risk. The software comes with a number of featured screens which have eye-popping performance and reliability. There is far more flexibility to the software than I will ever have time to explore, but with little time, I have been able to test ideas and optimize“
-

Jeffrey Busse
– Professor
“I teach a stock investing class, and we’ve used Equities Lab for the last two years. I find the software incredibly powerful, fast, and easy to use. It accesses a wide variety and large number of variables that one can combine in a multitude of ways in order to screen for stocks. What sets it apart from many products is its backtesting capabilities, where one can examine how a particular strategy would have performed over a variety of past market conditions, including bull, bear, and sideways“
-

Richard Evans
– Professor
“I had the students in my investments course use Equities Lab and had a good experience. The interface is very intuitive and the program is surprisingly quick at calculating returns from a back test of various investment strategies. The developers seem to be adding additional capabilities all the time and the existing functionality, in terms of the number of variables and the ability to modify those variables is quite impressive. Richard EvansDonald McLean Wilkinson Research ChairBusiness“
-

Jake Vodovoz
– Student fund manager
“Chief quantitative investor, Virginia Tech SEED During my time in college, Equities Lab has been an invaluable asset which has enhanced my knowledgeof investing in the financial markets. As a member of Virginia Tech SEED, a student-managed investmentfund managing $5 million, I had the privilege of using Equities Lab to help create, support and implementa value and momentum equities algorithm. This software has played a massive role in the work andresearch I have been able to conduct while“
-

Vikas Agarwal
– Finance professor
“Equities Lab is a wonderful tool for anyone that is interested in investments. Several students of mine have tried this product and found it to be especially useful for implementing popular trading strategies used by hedge funds. I would highly recommend trying it out!“
-

Sugata Ray
– Finance professor
“It was a breeze to develop and back test strategies. As a finance professor at the University of Florida, both my students and I use Equities Lab to engage in fundamental and technical analysis. Nick has helped with the learning curve and once we were comfortable with the product, it was a breeze to develop and back test strategies to meet investment objectives. I highly recommend the product.“
-

Alan Wind
– Investor
“Equities Lab is robust modeling software with data-rich features, including the ability to model quantitative strategies of well-known managers. If you can conceive it, you can back-test and easily create screens using EL. The support is excellent; they are passionate about investing and making this a premier product so there are frequent improvements and additions. I heartily recommend them.“
Your Personal Laboratory for developing investment strategies
Adaptable
We handle detailed formulas, intricate investing procedures, deep financials, breadth studies, and more — to bring your idea to life.
Unbiased
We avoid bias, and filter out uninvestable stocks. That means no survivorship bias, no lookahead bias, no restatement bias, and no illiquid penny stocks.
Transparent
We have 500+ formulas, covering a span of academic papers and empirically validated ideas. You can use them, tweak them, and see them used in our 500+ prebuilt screens.
Educational
Autograded assignments, ranking in classes, student portfolios, and the ability to limit stock selection all work together to make a terrific classroom experience.
Maximize your investment potential. Experience the difference for yourself
Frequently Asked Questions
After you sign up, you’ll notice we don’t charge anything right away. We want you to have time to explore Equities Lab, and see how it can help you. After the free trial ends, we’ll simply charge you according to whatever plan you’ve chosen.
Canceling is simple — just use the web interface, or email us at support@equitieslab.com, or call! All three ways work effectively. If you think you’ve been billed in error, or are worried about canceling in time, just let us know. We’ll fix it with no problems.
If you forgot to cancel in time, or you are unhappy with the service, let us know! We’ll refund you. We don’t want your money unless you want us to have it.
High quality Morningstar data is built into our product to cover pricing and fundamental data, and we use FRED for macroeconomic data. This means no data fees for you.
You can use our output in a variety of ways. For instance, you can create reports, write blog posts, make trading decisions, create Seeking Alpha articles, make recommendations, document your investing , or even just feel validated that your approach is a good one. It’s up to you!
We cover stocks and ETFs that trade on US exchanges. We have some Canadian stocks on an experimental basis, but you have to opt in, as we are still reviewing them for completeness and accuracy.
Unfortunately, we don’t run on Android, Chromebook, or iOS. This means we don’t run on tablets. Since you are using Equities Lab to do serious research, and find new stock market edges, you need something that can allow you to express yourself, and you need to handle intricate visuals and absorb information. That implies a keyboard and a mouse, and that, in turn, implies a computer.
Backtests, by their nature build on past results as they iterate forward. Most backtests rank and collate large collections of stocks. Many backtests do this multiple times in multiple way. Because data is constantly subject to revision and reclassification, these process will shift over time. The results should be similar, but will not be identical to what they were in the past.
This turns out not to matter, because the results you got in the past definitely will not be the same as you get when investing real money. The (unavoidable) shear between backtest and reality is more of a problem, and it (as well as the drift I’m calling attention to here) are handled by changing rebalance procedures, changing all your parameters slightly, and doing other tests for robustness, and assuming your future performance will mostly correspond with one of the more mediocre lines you get while validating.
We use real time data in one place: when we place simulated trades in our simulator. Other than that, we do not use or provide real time data.
Fundamental data doesn’t change from minute to minute. Fundamental data also drives the long term destiny of stocks. Focusing on intraday data relagates you to the role of a scalper or market maker, rather than an investor. It is hard to advertise the ability to save time and streamline processes if you are placing trades every minute.
For those reasons, we don’t offer intraday data. We have open, High, Low, Close Volume data for stocks and ETFs, together with fundamental data for stocks and macroeconomic data.
Yes! Stop losses are modeled in backtesting by comparing, each day, the Low and the Open price against the stop loss. If the Open is lower, the stock is modeled as having been sold at the open (which means you got a lower price than your stop loss). If the Low is lower, and the Open is not, you are sold at your stop (modeling a limit order in an orderly market). We do not model participants with unfair advantage, who can see your stops, move the price lower to take you out, and then push the market back.
Trailing stops are modeled as well, though not as well. Trailing stops are handled just like regular stops, except that the stop is moved up each day, according to the stop loss. Since they do not move down when the price moves down, the trailing effect is modeled.
Stop losses and trailing stop losses can be either percentages of the closing price, or any other formula. For instance, you could make the stop loss the 52 day low, or the current close – 2 * the average true range, or the current close – one yearly standard deviation.
We have a collection of articles. We’re interested in adding to that collection, as well as adding tools.