Having the Idea
To write a screen, one must first have an idea. Although the term “idea” brings to mind one, and only one light bulb, most usable screens are a bit more complicated than that. We are building this screen out of a “baseline”, or subset of stocks that we’ll consider investing in. Having created the baseline (this article), we’ll go on to figure out what performs well (next article), and pull it all together into a portfolio (last article).
Size (a.k.a. Market Cap)
This screen is going to be about mid to large companies that sport mid to large market caps. Using larger companies lets us trade more frequently, and will have us holding portfolios that “seem” more familiar. We choose 2 billion as our cutoff, but we want only to count a stock as belonging to the club if it has been there for a quarter. Otherwise, we’ll include companies that qualify due to sudden spikes in valuation (i.e. bubbles). These aren’t typical mid to large caps. We also insist on liquidity: even taking a 100k position in a stock all at once shouldn’t push the price too far.
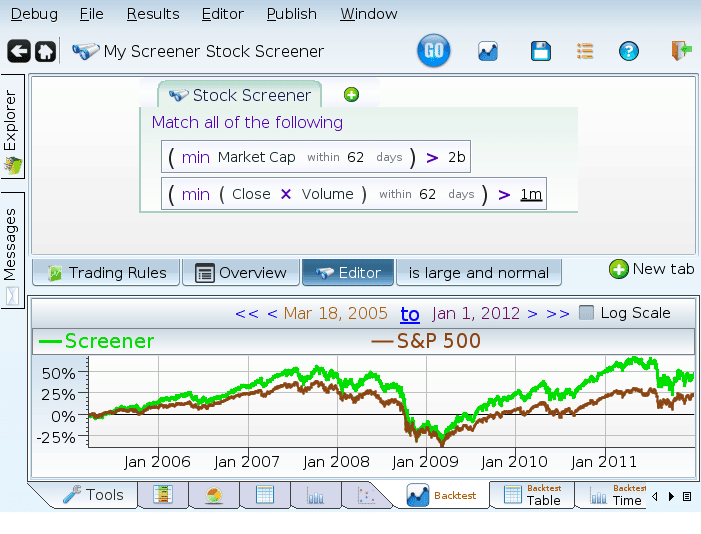
Looks like they did OK. Wait a minute! Why did we stop in 2012? We need an out of sample period. If we didn’t have one, we wouldn’t have any way of predicting whether our performance is due to us torturing the data (a vivid name for overfitting), or due to actual, tradeable alpha. So, we restrict ourselves to the past, for this screen. We’ll jump back to the present later.
Exclusions
ADRs (American Depository Receipts)
The first bank of exclusions will be foreign stocks.

REITs
Next up are REITs. What, you ask is a REIT?
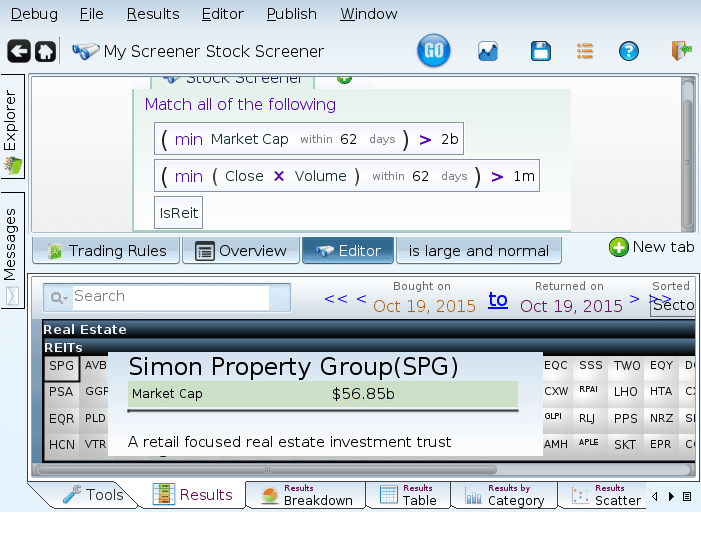
REITs allow investors to invest in real estate and receive a regular dividend. A set of shopping malls is a great example (see SPG, above). These companies don’t manufacture anything, aren’t services, don’t do research, don’t want to grow in the same way, and are odd ducks. That doesn’t make them bad investments, though. They are just not similar to ordinary stocks. We’ll write an essay on them later.
Limited Partnerships
Limited Partnerships are Limited Liability Companies that have one General Partner, and a larger collection of Limited Partners. The general partner manages the enterprise, while the limited partners do nothing but collect income. This doesn’t sound so different from regular companies: after all when was the last time you had to hire or fire a MSFT employee? But companies that are incorporated this way have different reporting requirements, making them unusual. They also send their limited partners a K-1 each tax year. Some will send more than one K-1, depending on corporate structure (Buckeye, LP sent us 30 K-1’s one year as they have operations in 30 states. At least that’s what we could figure out. Needless to say, we sold that stock). These forms will make your taxes more fun to do. Hence the exclusion.

The Null Score
The null score simply counts a collection of 50 fields that commonly are reported, and indicates what percentage of them have values. We don’t care what those values are — we just want to know that they were reported. Why? So we can throw companies out, of course! Seriously, if the financials are missing all sorts of data, we are going to have a hard time screening on them. Did we pick the right magic 50 fields? No, of course not. But we diversified by picking 50 of them. We exclude companies with a null score over 20, on the grounds that that’s too many missing fields. Looking at the high null score candidates we won’t be investing in we see AIG, Wells Fargon and a variety of complicated companies with complicated financials that we’d be hard pressed to make sense of. The null score test lets us just skip the pain.
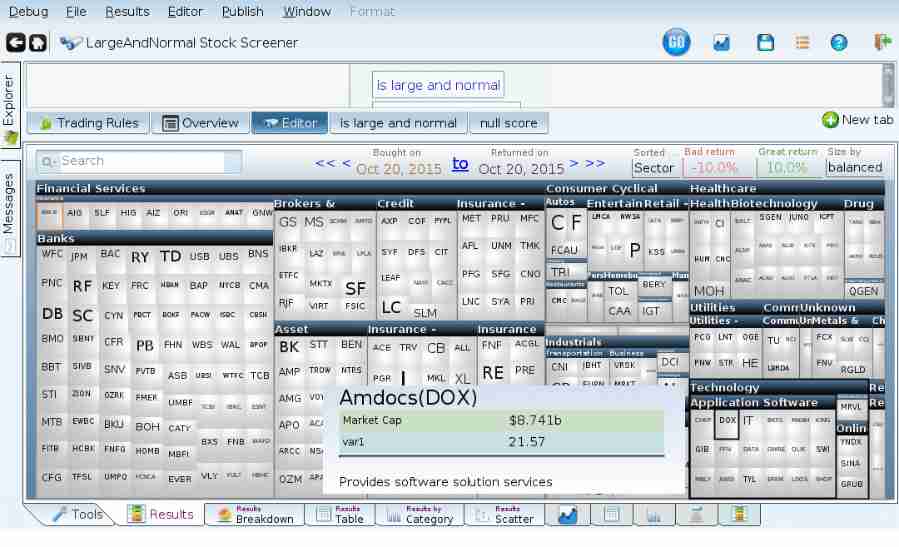
Apparently, we don’t do ourselves much damage by skipping this segment of equity universe.

Recent IPOs
We don’t include recent IPOs for the same reason we don’t like companies with a high null score: too little information. Various sites have info about IPOs. There are other reasons to be wary of IPOs: initial mania and insiders unloading their shares as soon as the lockup period expires. The first is that everyone bought into the stock, and are excited. The second is more complicated. Company employees and directors are banned from selling their stock by the terms of the IPO for a certain period. When these periods end, the insiders are eager to diversify, and they do this by selling more stock — increasing the float and diluting existing shareholders.

For what it’s worth, IPOs are more volatile, but did outperform during the period we’re optimizing over, at least in the large cap non-foreign, non-etc space we’re looking at.

Putting it all together
So what do we have left? The S&P 883? Granted we do match 883 companies, but we don’t do anything beyond what we’ve described so far to rule companies out.
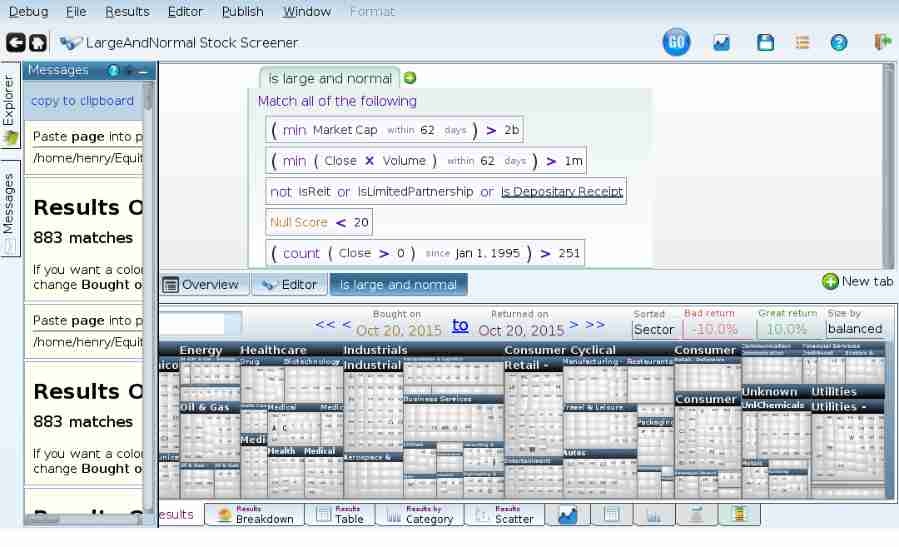
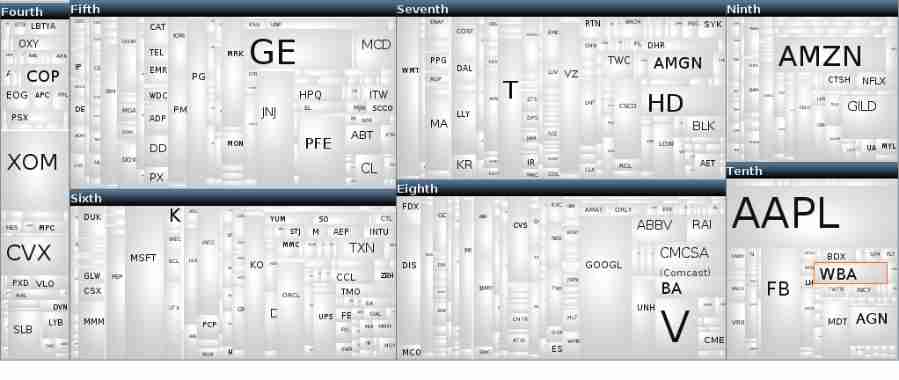
Lets dig into this a bit more to see that we have a representative pile of stocks. With this term

I get this.

What does this mean? It tells me that we have an even breakdown almost everywhere, with only two deviations: we have fewer companies in the bottom of the honesty scale. Apparently the worst manipulators have trouble getting into our baseline. Also companies with low sales growth are underrepresented: notice the missing first and third deciles. To put some color on that, here’s what we get when we zoom in on sales growth by decile, sizing by market cap:
We’re done with creating the baseline — we have a set of 883 stocks from which we can create our screen. See you in the next article!