An unspoken fear for investors is false information. The U.S. Securities and Exchange Commission (SEC) protects investors from market manipulation. So if you have fears, don’t fret!
If you’re unsure of a company, the SEC will give you valuable financial information and details to know if it’s worth the investment. Don’t walk into any trading situation uncertain. Find all the resources available and learn how to use them.
What is the SEC?
You might be wary of anything related to the United States federal government. However, when it comes to investing, it can give you the latest tea on companies.
What is the SEC? An independent agency (not under the president’s control) of the federal government that enforces laws on companies to tell the truth.
How does the SEC help investors? The SEC helps investors by “maintaining fair, orderly, and efficient markets,” “facilitating capital information,” and ensuring that companies, brokers, dealers, and exchangers tell the truth about a business or trade”.
Think of it as the lie detector test of the financial world, and you get to see all of the results! You can view Quarterly Reports, Financial Statements, Annual Reports, etc.
Why was the SEC established? In response to the great depression, the SEC was created in 1929 to prevent future market crashes. It was founded due to the large amount of dishonesty, fraud, and manipulation in the securities market that debilitated the country through the great depression.
Looking Into the SEC Details
The SEC is the map that will give you details you want about a company’s financial activity. The official statements put out by a company can fudge the actual data in a financial report or income statement. Make sure to read the actual numbers for yourself!
After testing several different screeners, AT&T (T) fit a particular strategy. Here are the financial metrics for AT&T:
| Financial Metrics | AT&T ( T ) |
|---|---|
| Closing Price | 14.73 |
| 52 Week Range | 13.43 — 22.84 |
| Market Cap | 103.8b |
| Volume/Avg. 30 Day | 25.99m / 40.81m |
| P/E | ? |
| Dividend/Yield | 1.11 / 0.0754 |
| EPS T12M | -1.18 |
| Piotroski F-Score T12M | 4 |
| Beta | 0.5747 |
| Red Flags | Price a third of all time high, EPS in freefall large-cap |
| Green Flags | Operating cash flow positive 4q, capital expenditure less than depreciation |
Your initial reaction to these numbers may be confusion over the negative EPS.If we follow the link provided in Equities Lab for the SEC, the following information can be found:
What negative data was in the SEC report? (dollars in millions) Accounts Receivable went from 11,466 to 9,304, decreased operating cash by 11% yearly, $151 billion in debt, and decreased employees significantly.
The above numbers pop out. Let’s look at what we would see if we backtested them.
AT&T’s Performance
The best way to evaluate AT&T is backtesting by surveying those factors. If you use Equities Lab, following the instructions below will let you see the same graph/data in this article.
- Create a ticker for AT&T (t) in the input box.
- Name a new tab “plot_debt”
- Type “Total Debt 1Q”
- Create another tab named “plot_operating_cash”
- Type “operating cash flow 1q”
- Create another tab named “plot_accounts_receivable”
- Type “Accounts receivable 1q”
- Backtest over a 5-year period (2018-2023)
The below graph demonstrates the decline of AT&T, along with the variables that were so intriguing in the SEC report. AT&T (green) has a rise and then a volatile decline, while the S&P 500 (dark red) has a steady incline. The other lines all visualize accounts receivable, debt, and operating cash, the information that was intriguing in the SEC report.
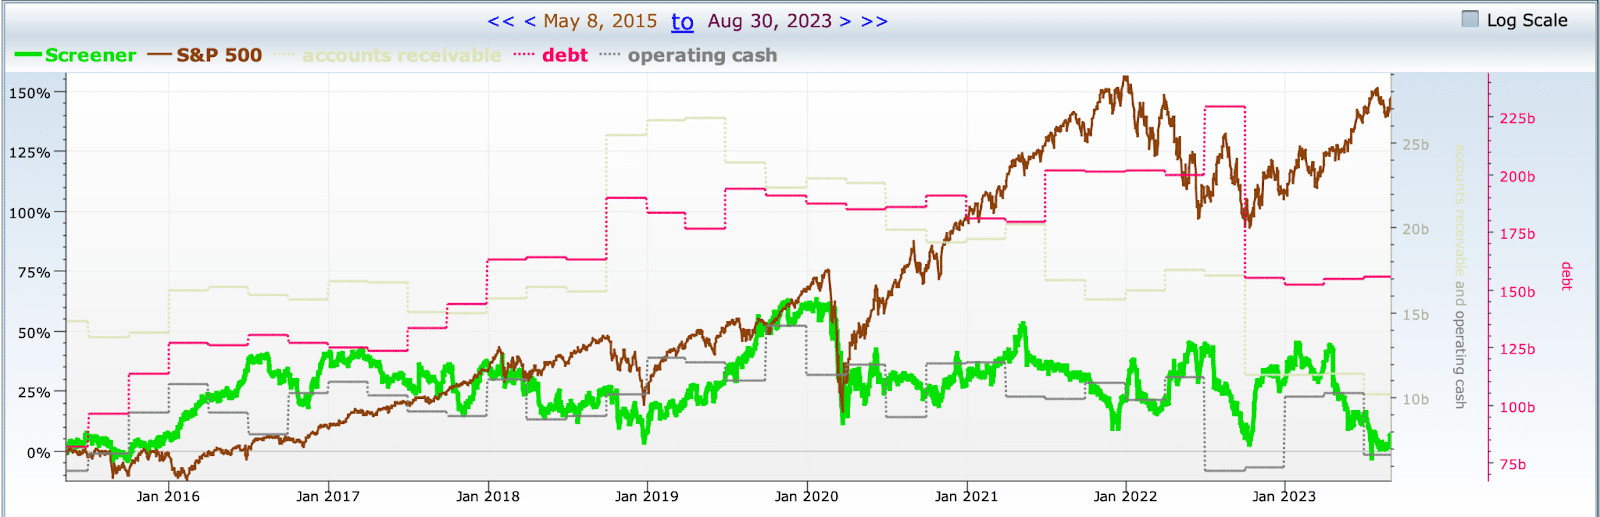
If you go over to the backtesting report seen below, you can find the individual numbers for each factor. On August 30th, the accounts receivable was 10.2b, debt was 155.9b, and operating cash was 6.678b.
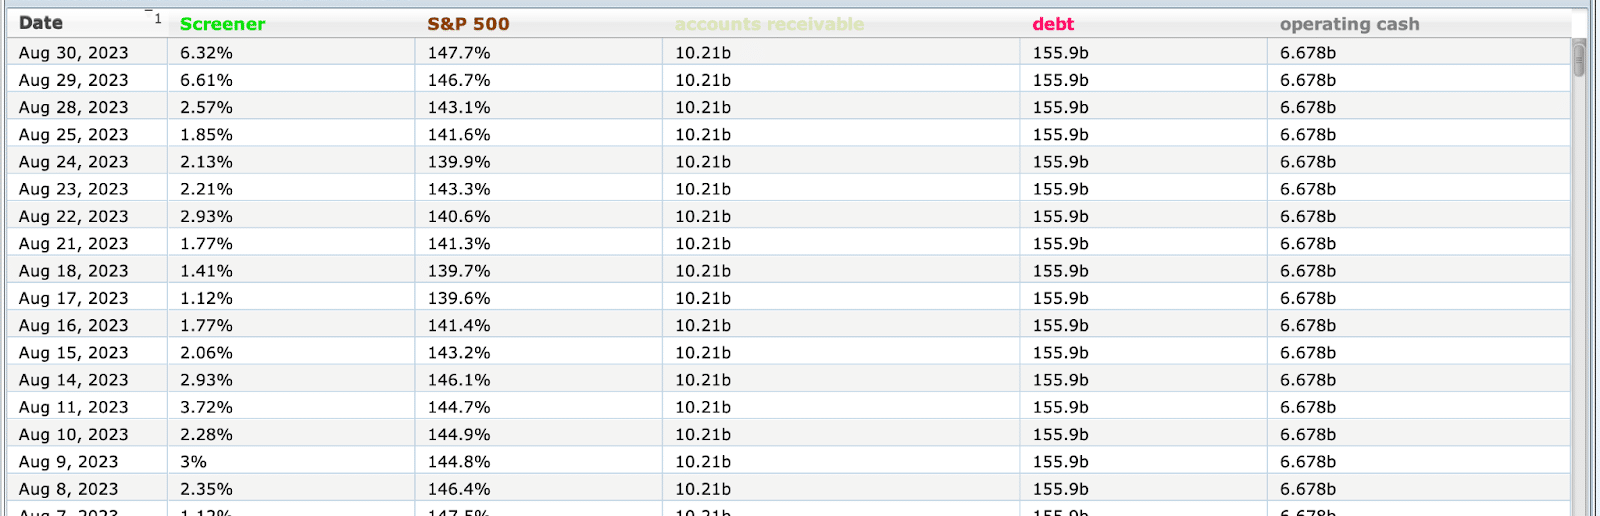
(You can sort the information in each column by clicking the header of each column.) For the chart below, each column’s worst and best days are documented. (Red indicates the worst and green indicates the best.)
| Date | AT&T (T) | S&P | Accounts Receivable | Debt | Operating Cash |
| Aug 30, 2023 ; Current date | 6.32% | 147.7% | 10.21b | 155.9b | 6.678b |
| Aug 25, 2015 | -3.92% | -11.07% | 13.58b | 96.45b | 6.738b |
| Feb 11, 2016 | 13.54% | -12.18% | 16.33b | 126.93b | 10.8b |
| Jun 30, 2023 | 15.13% | 143.4% | 10.21b | 155.9b | 6.678b |
| Jun 30, 2022 | 42.52% | 103.8% | 17.22b | 229.52b | 5.732b |
| May 8, 2015 | 0% | 0% | 14.53b | 82.07b | 5.745b |
| Jan 22, 2020 | 63.2% | 72.06% | 22.92b | 187.46b | 11.39b |
| Jan 3, 2022 | 25.39% | 156.2% | 16.3b | 202.11b | 9.866b |
| Mar 29, 2019 | 21.42% | 44.6% | 26.47b | 176.5b | 12.08b |
| May 8, 2015 | 0% | 0% | 14.53b | 82.07b | 5.745b |
| Sep 30, 2019 | 52.64% | 53.36% | 22.38b | 191.13b | 14.28b |
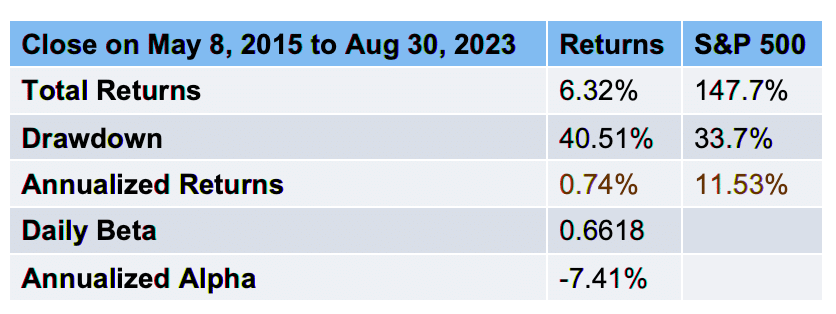
If you set the backtest to over 23 years, AT&T has struggled within the market, according to the chart below. It has total returns of 6%, a high drawdown rate, low annualized return, and the market crushed it in annualized alpha. The positive? It isn’t sensitive to the market!
Takeaways
Initially, these factors set off a red flag about AT&T.
- Accounts Receivable
- Debt
- Operating cash
After backtesting, it is evident that AT&T has struggled with its debt for quite some time and has recently been vulnerable because of interest rates. Accounts Receivable is at its lowest recorded value within the last five years (the same as on its worst date for the same factor), while operating cash isn’t doing great either.
Should you invest? Maybe double-check your investment plan before considering putting money in AT&T.
What’s the takeaway? Use the SEC then backtest for standout data! The road went very far from the beginning purpose of the financial police, but we got to the bottom of why it’s worth investigating. The SEC will provide indicators of what to test for, and AT&T was put to the test.