
Backtest
Advanced Backtesting: Powering Your Investment Decisions
Our cutting-edge backtesting engine empowers you to rigorously test and refine your investment strategies with unparalleled depth and precision
- Comprehensive Historical Data: Leverage over 25 years of meticulously curated market data, including hard-to-find information on delisted stocks to eliminate survivorship bias.
- Rapid Simulation: Generate detailed performance analytics for complex strategies across decades in mere minutes, accelerating your strategy development process.
- Real-World Stress Testing: Evaluate your strategy’s resilience through pivotal market events like the 2000 dot-com crash, 2008 financial crisis, and recent pandemic volatility.
- Advanced Risk Metrics: Gain deeper insights with sophisticated risk-adjusted return measures, drawdown analysis, and correlation studies.
- Customizable Parameters: Fine-tune your simulations with adjustable transaction costs, dividend reinvestment options, and position sizing rules.
- Benchmark Comparison: Automatically compare your strategy’s performance against relevant market indices or custom benchmarks.
- Intuitive Visualization: Interpret results effortlessly with interactive charts and heatmaps that highlight your strategy’s strengths and potential weaknesses.
By combining historical accuracy, computational power, and user-friendly analysis, our backtesting suite provides you with the confidence to implement data-driven investment strategies in today’s dynamic markets.
Discover
- How did your strategy perform during the Great Recession?
- What percentage of stocks in your universe were delisted?
- What’s your strategy’s industry concentration ratio?
- What was your strategy’s maximum drawdown?
- What were your strategy’s key buy triggers and timing patterns?
- What’s your strategy’s Sharpe ratio?
- What’s the typical and range of stock count in your portfolio?
Customize
- Stop-loss and take-profit levels
- Minimum and maximum holding periods
- Position weighting, including long/short allocations
- Stock selection criteria and timing
- Maximum number of stocks in portfolio
- Key variables to monitor and plot
- Benchmark indices for performance comparison
Customizable trading costs
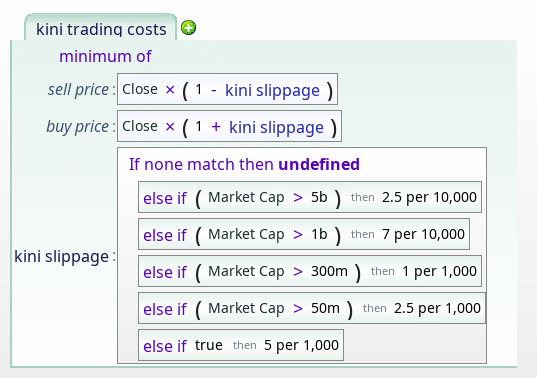
In reality, trading costs vary by stock, time, and the specifics of your brokerage. These factors can and will significantly impact your overall strategy.
At Equities Lab, we model trading costs as slippage, allowing you to customize them with a formula that can reference any attribute of the security being traded. You can set market cap thresholds, use average trading volume, or create a composite formula tailored to your specific needs—just like the Kini Trading Costs model.
Long/Short Portfolios
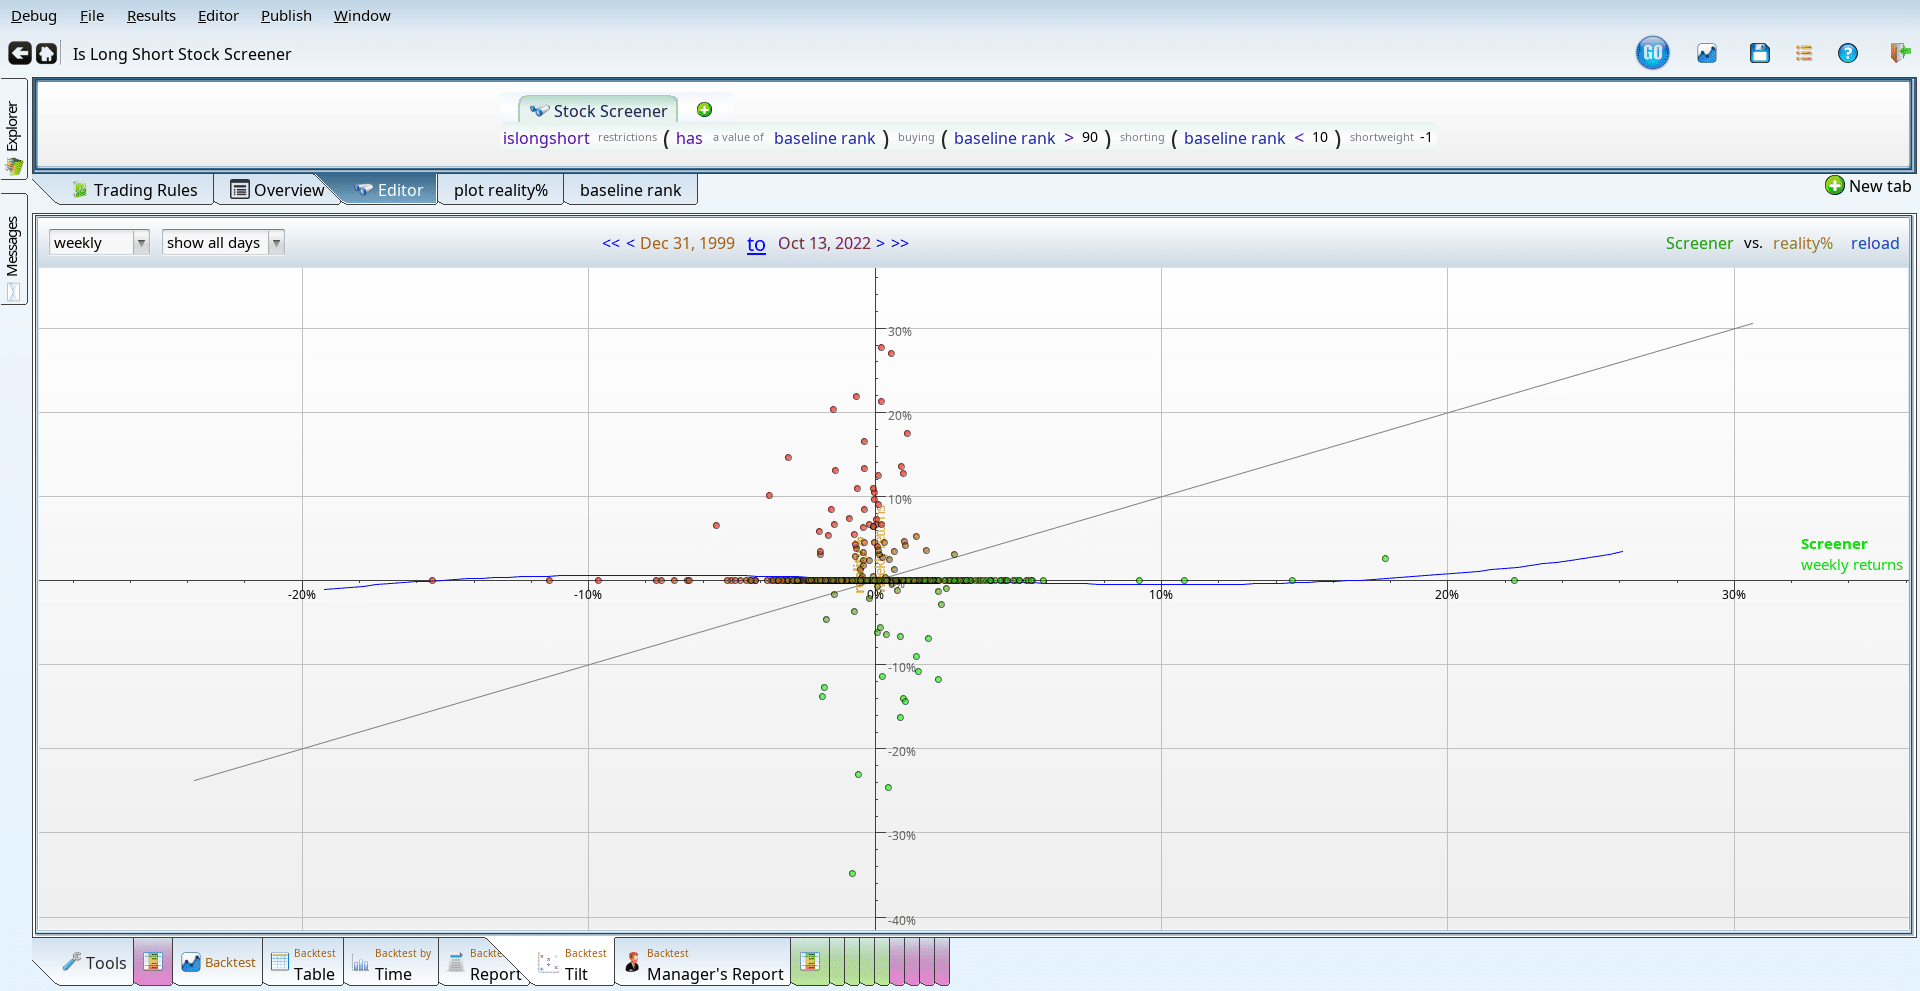
The backtest tilt in this case shows an alternative look at a long/short portfolio. The dense clustering of points around the y-axis suggests that the strategy made significant moves—either up or down—even when the market was relatively stable.
The points clustered around the x-axis indicate periods of drifting while the market was in strong motion. As with many long/short strategies, market correlation is minimal, with a beta of just 0.007. This low correlation allows the strategy to achieve an alpha of 2.25%, despite only rising half as much as the broader market.
Maximum holdings
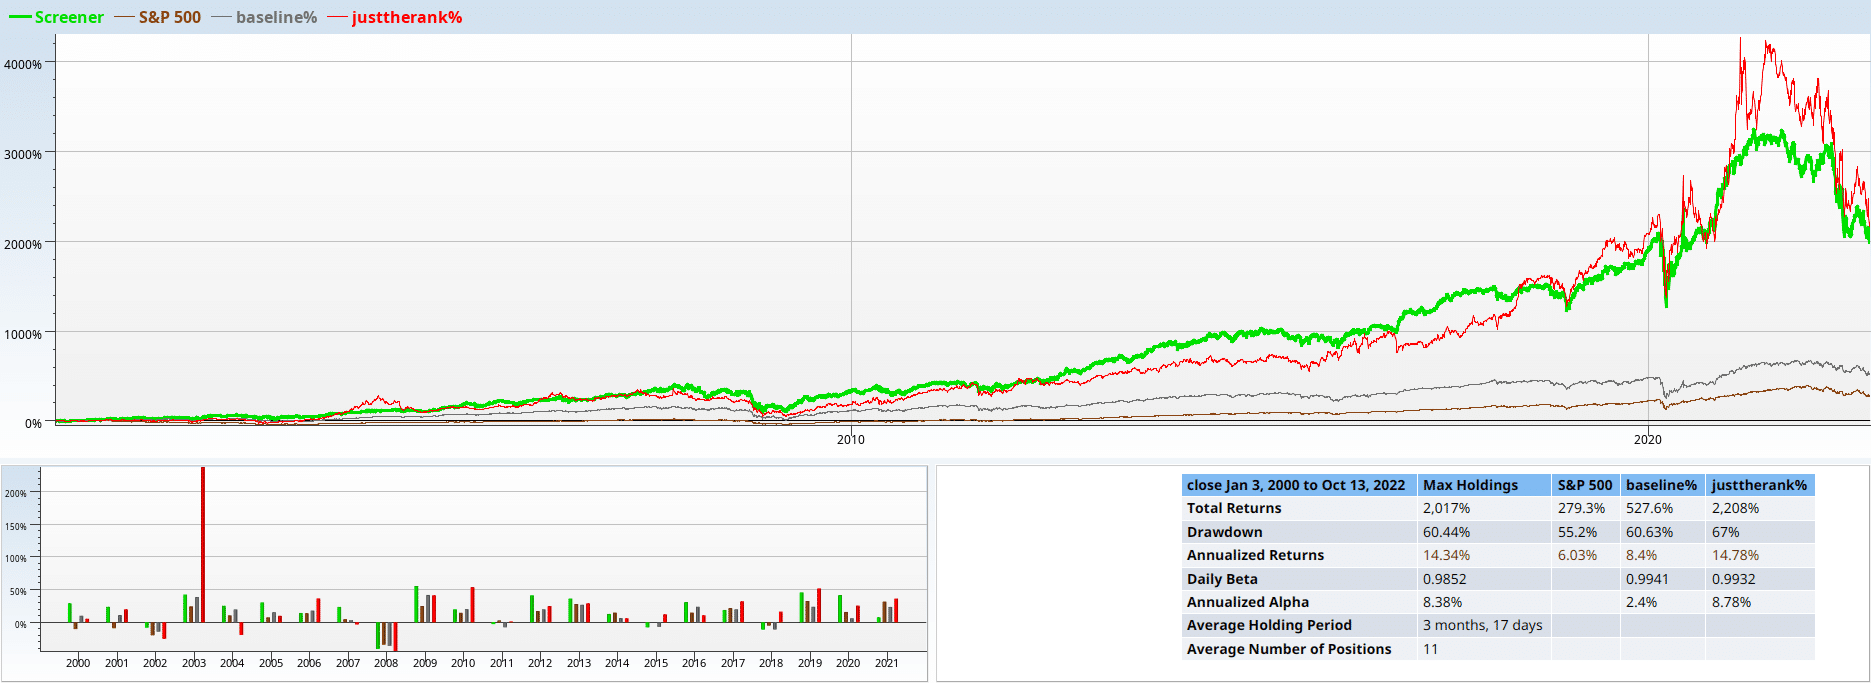
Are you concerned that your portfolio might be too large? You can easily limit the number of stocks in your portfolio. In the above example, the max holdings has been set to 5, with the ranking factor being Income Statement Score – Balance Sheet Score.
Stop-losses And stop profits
While stop-losses can help reduce volatility, they can also affect overall performance. In the graph above, the green backtest line utilized a 20% stop-loss until 2010.
After 2010, the strategy became more conservative, implementing a 10% trailing stop-loss. The green backtest line closely follows the orange baseline up to 2010, but then it seems to just lose momentum. Could the tighter stop-loss be the reason?
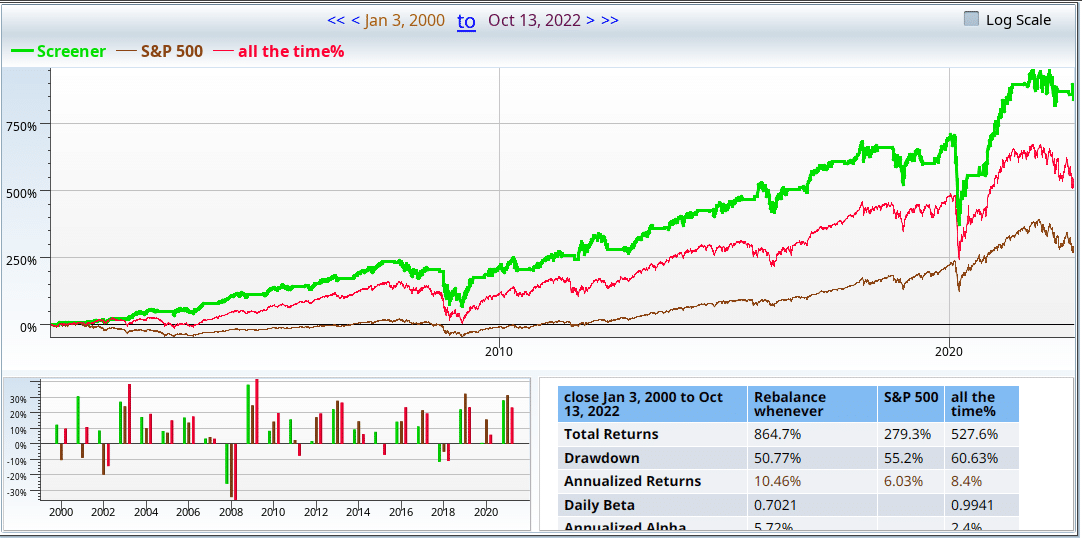
Constrained Holding Periods
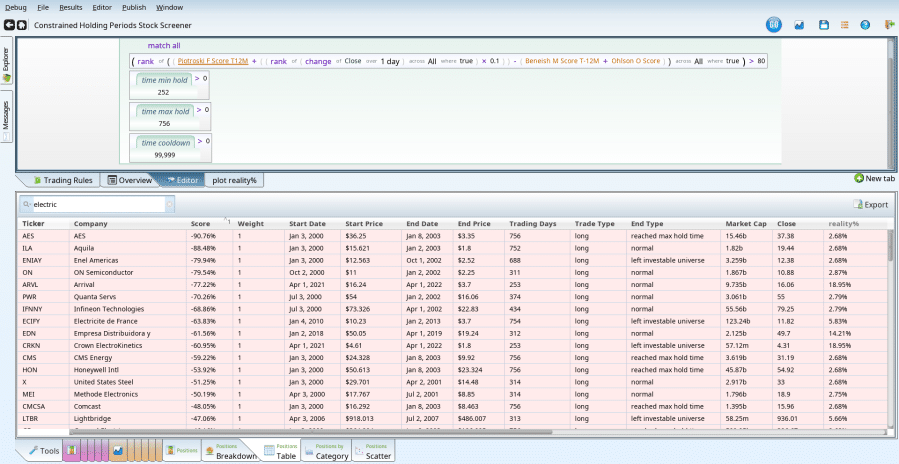
Investors are human, and their behavior often reflects that. Typically, they won’t jump out of a position they have just entered, and they may be reluctant to repurchase a stock they sold earlier that year.
Do these human tendencies make a difference or impact performance? Find out! The grid above illustrates a list of trades where the investor trades on a quarterly basis, is unable to sell for at least one year, refuses to hold a position for more than three years, and never repurchases a stock they have sold. As expected, this approach underperforms compared to the base strategy, which has outperformed since 2010.
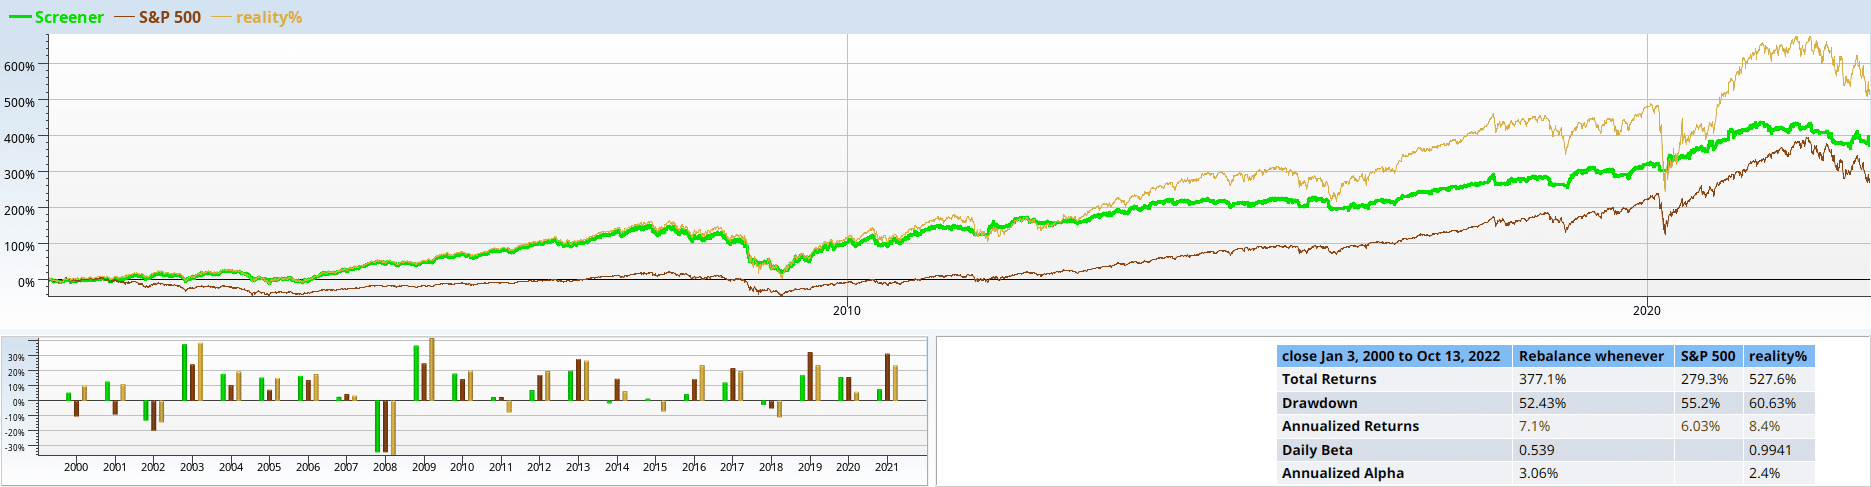
Rebalance anytime
This strategy combines an ordinary Beneish/Piotroski/Momentum combination with a seasonal twist—avoiding holdings during the summer months and certain unfavorable holidays.
The particularly intriguing part here is that the screen rebalances every time we go from a vacation period to a non-vacation period. This occurs several times a year, at irregular intervals. The red line on the graph represents the screen’s performance, which consistently outperforms the market.
Conclusion
Backtesting is an invaluable tool. It allows you to explore historical market data, understand the impact of various factors, and evaluate how your strategy would have performed over time. It can help you avoid costly mistakes and guide you toward success in your trading journey.
Are you ready to elevate your investing? Contact us at sales@equitieslab.com today to start using Equities Lab and take your strategy to the next level.