
Stock Picks
In the overview tab, tear sheets are available. These give useful information about the stock. You can switch to another tear sheet by clicking on a stock in the heat map and clicking “Switch tear sheet” on the pop-up.
Now switch to the Trading Rules Tab. Click on “Buy and Hold Trading Model” to select a different trading model. Choose the Simple Moving Average trading model.


The graph will now shows the returns if you had traded your stock using the Simple Moving Average Trading Model. This Trading Model buys when the shorter moving average (12 day) is greater than the longer moving average (26 day). You can go to the Buy Tab to see actual terms used to create the trading model.

The green line in the graph above represents your return if you would have traded the stock based on the simple moving average trading model.
The green shading represents when the trading model was true and the stock was being held.
Try clicking “Results Candlestick” tab at the bottom of the screen to view a chart like the one below.

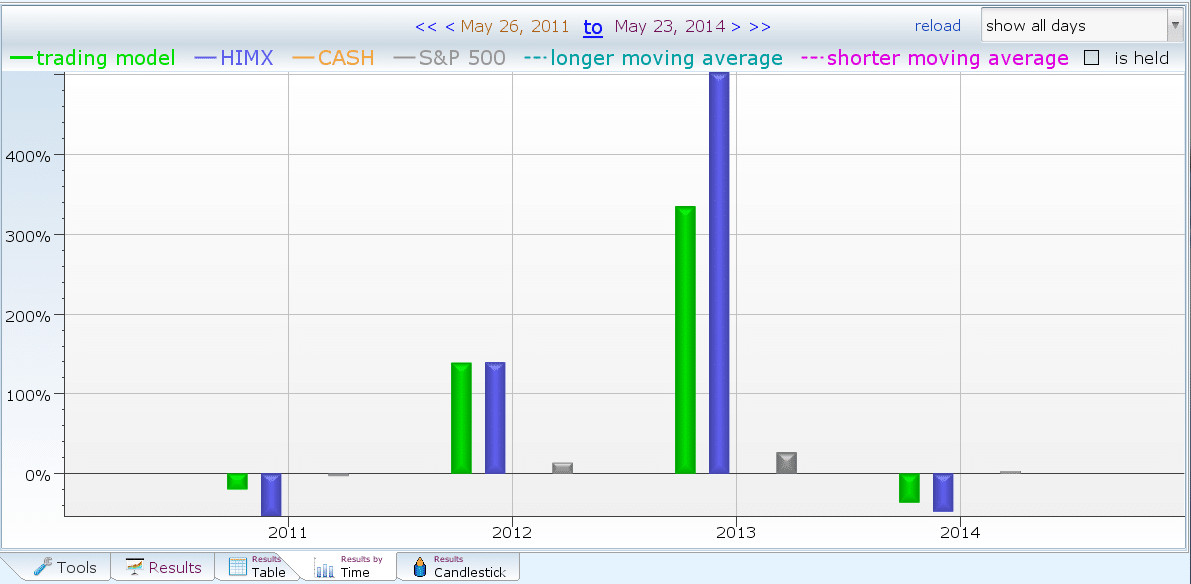
Click on Results By Time to see a breakdown of the performance by years, months, etc.
