
Validating a Strategy Ft. Rebalancing

If you love the results when you backtest a screener but find a difference between the screener and reality, you are probably missing a vital step! Validating your strategy before taking action is a simple step you don’t want to overlook.
Something as simple as testing over extended periods of time, flipping through data columns, and rebalancing can make a world of difference. Rebalancing is what this article will focus on.
The Value of Rebalancing a Strategy
What does it mean to validate a strategy? It means to ensure that it is ACTUALLY a successful strategy and not just a randomly doing well in the market. Validating a strategy means removing any outliers or unpredictable fluctuations while strengthening your understanding of the best approach to that strategy.
What is rebalancing? When you take your account, analyze all your investments against the original criteria you invested under. If any securities no longer fit that criteria, you sell them.
How does rebalancing validate a strategy? Every strategy demands a certain amount of time. Some are more time-intensive (day traders), while others are passive. Rebalancing a screener with different criteria when you backtest will inform you of the best (or worst) times to rebalance.
Some strategies will only be successful if you rebalance monthly/quarterly. Meaning it requires frequent attention. If you rebalanced yearly, there might be a better strategy for something so passive. In contrast, other strategies require less time and would be more hands-off. You could find a low-volatile strategy and allow your investments to sit pretty without rebalancing.
How to Validate with Rebalancing
With Equities Lab, the steps for rebalancing are simple and easy to incorporate into any screener.
Getting Set Up
First, choose the screener you want to use (e.g. Slicing the S&P 500), and then check out the formula.
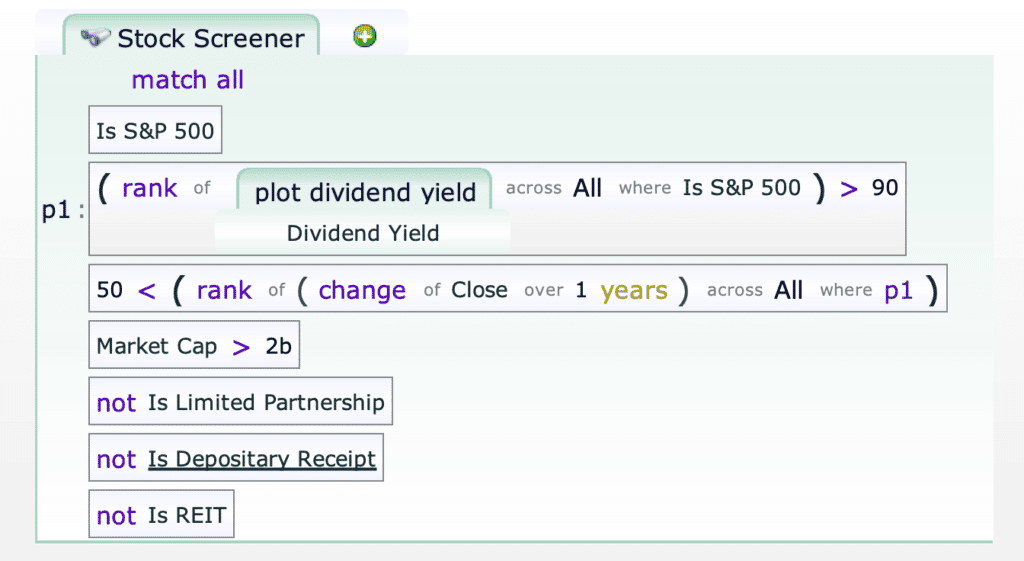
Hit backtest, and modify the dates to span 23 years (e.g. Jan 1, 2000 to Aug 31, 2023) for further validation. When you backtest, the rebalance is set to quarterly by default, and the screener below demolishes the market.
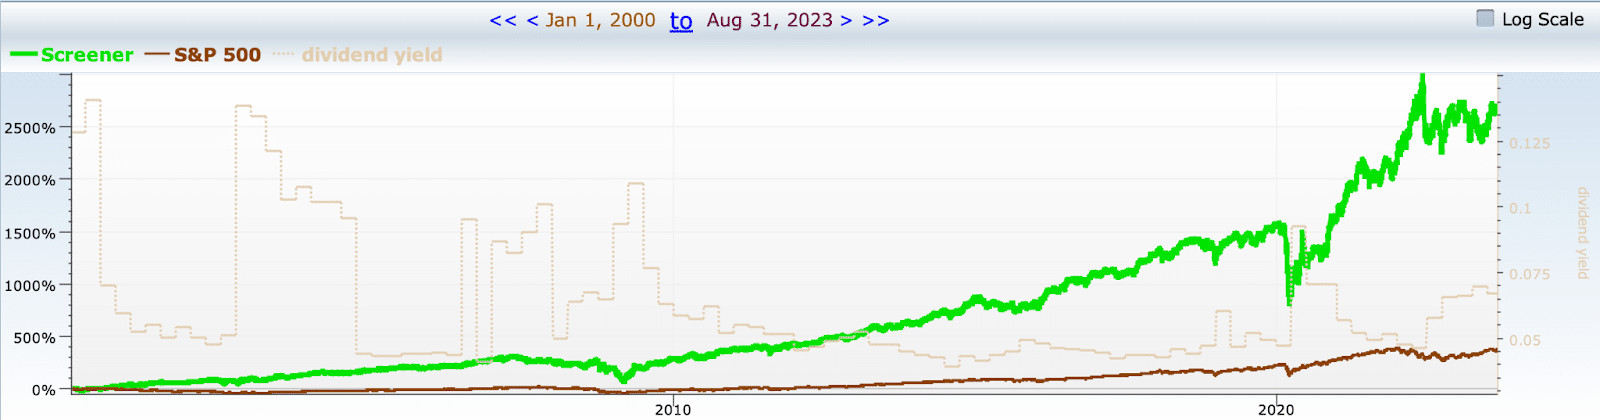
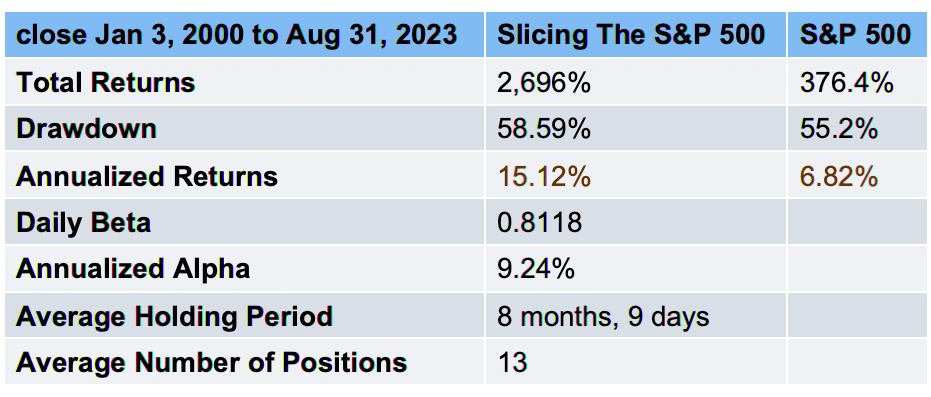
The data below shows an annualized return rate of 15.12%, green flags, and a screener that repeatedly beat the market.
After Rebalancing
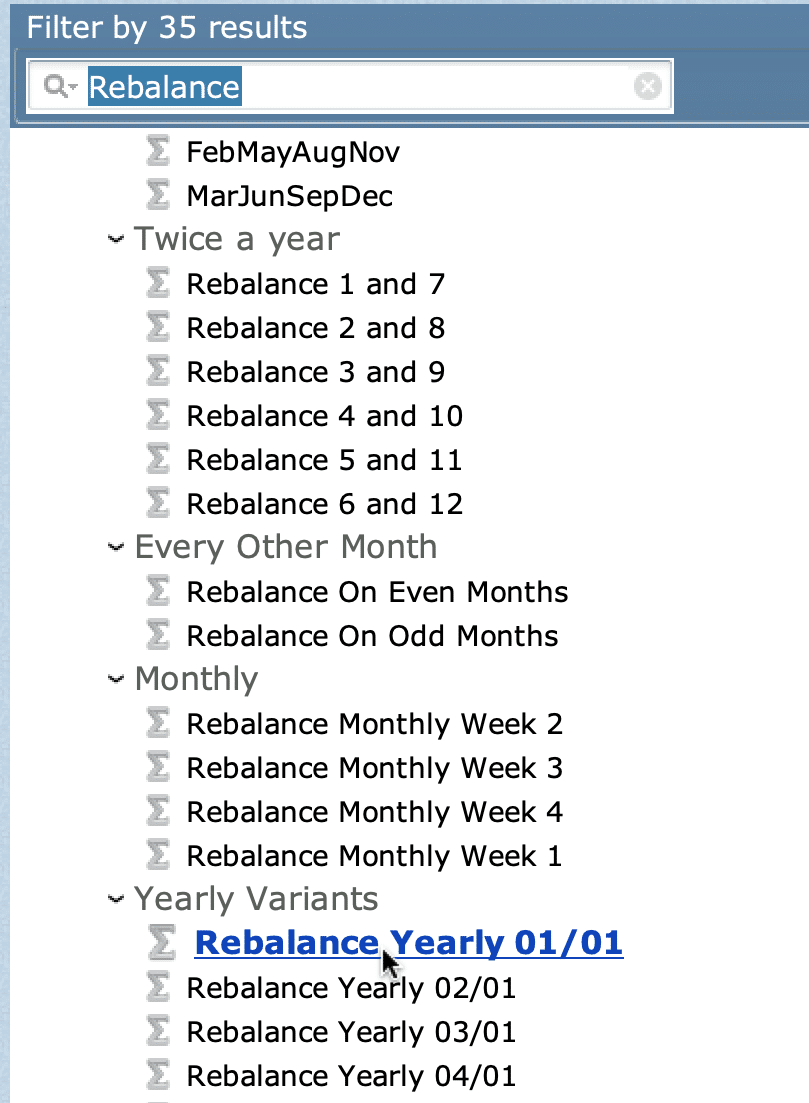
Now that you see the results from a quarterly rebalance, let’s adjust the criteria. Locate the “Trading Rules” tab next to the “Overview” tab. The below screen will appear with the backtest trading rules. Click on “Rebalance Quarterly.”
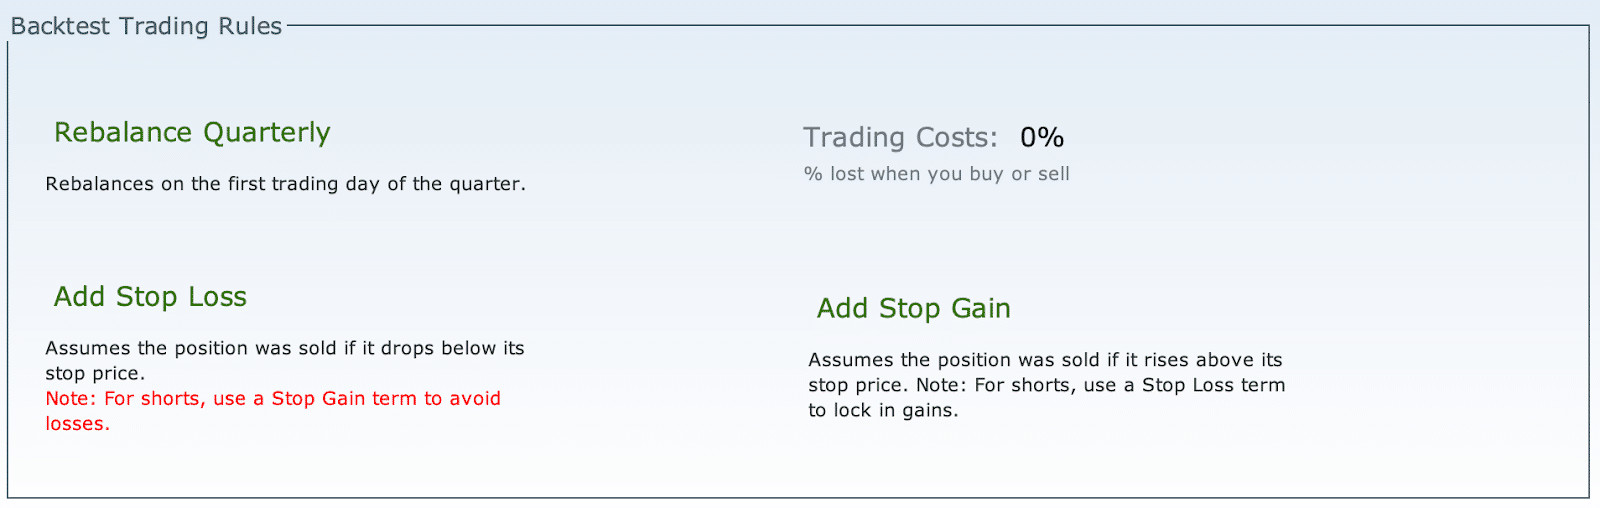
After selecting rebalance quarterly, you can see the options available for rebalancing. Select “Rebalance Yearly 01/01,” which will rebalance (not actually) on January 1st. Hit backtest to see how it shifts the results.
The data chart below exhibits why rebalancing is necessary. A significant drop is seen in performance compared to quarterly rebalance.
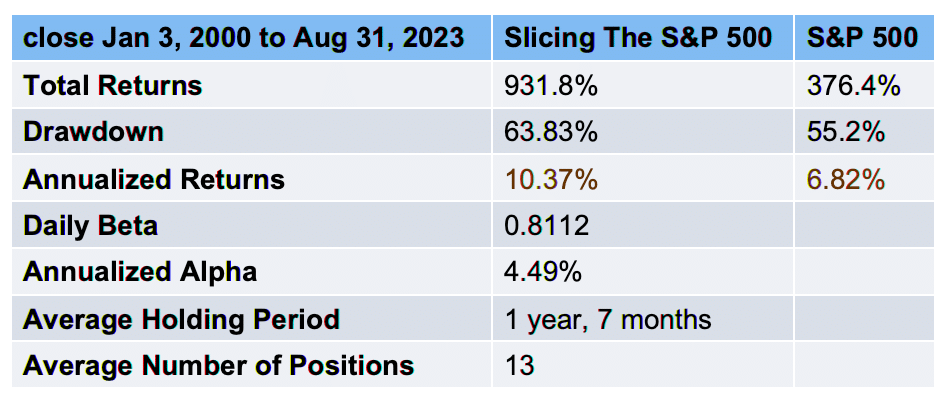
If you examine the chart below, it shows the numbers next to each other for easy comparison.
| Slicing the S&P 500 | Quarterly | Yearly 01/01 |
| Total Returns | 2,696% | 931.8% |
| Drawdown | 58.59% | 63.83% |
| Annualized Returns | 15.12% | 10.37% |
| Daily Beta | 0.8118 | 0.8112 |
| Annualized Alpha | 9.24% | 4.49% |
| Average Holding Period | 8 months, 9 days | 1 year, 7 months |
| Average Number of Positions | 13 | 13 |
It doesn’t mean it’s a poor strategy because of the dip in performance. However you should clearly rebalance quarterly for this strategy to be as effective as possible.
The Results
The steps to validate the strategy above only show the results for one screener with two different rebalancing criteria. We took the liberty to document 4 different screeners with 5 different rebalancing criteria. Every screener mentioned can be found under the “Featured Stock Screeners” in the Explorer tab.
The percentages below reflect the annualized returns backtested from January 1st, 2000, to August 31st, 2023, nearly a 23-year period. The rebalancing is categorized from daily, weekly, the first week of every month, quarterly, and yearly, starting January 1st. Note that the other criteria, like bi-weekly, a different week in the month, a particular quarter, or which month in the year you’d want to rebalance, all have different results.
| Rebalance | Slicing the S&P | Increasing Income | Low Volatility w/ Good Returns | Utilities and Consumer Defence FTW |
| Daily | 16.04% | 15.13% | 9.45% | 9.54% |
| Weekly | 15.88% | 14.3% | 8.71% | 9.43% |
| Monthly Week 1 | 15.83% | 13.26% | 8.57% | 9.1% |
| Quarterly | 15.12% | 11.19% | 8.56% | 9.42% |
| Yearly 01/01 | 10.37% | 15.27% | 7.25% | 8.84% |
What does it show? The most successful strategy for daily trading was Slicing the S&P. The best approach yearly was Increasing Income. The least volatile across all the screeners was the Utilities and Consumer Defence FTW.
Takeaways
Maybe your strategy’s positive performance isn’t becoming a reality because you aren’t optimizing for the best rebalancing criteria.
It isn’t a red flag if a screener has a drastic difference in performance once you adjust the rebalancing period, but it is something you must be aware of. You would get the worst performance if you invested using the Utilities and Consumer Defense FTW screener and rebalanced yearly. Still, then you would get drastically different results from Increasing Income.
Consider Your Trading Strategy: Consider your goals regarding gains, passive investments, attention-intensive strategies, risk, and industry while exploring what is available. You need to test screeners to know what you want to get involved in.
Consider Your Time Commitment: Regardless of if you want the biggest profit despite the risk, do you have the time? Consider your ability to commit your time to daily trading over quarterly adjustments.
Slicing the S&P 500 is still wildly successful if you’re investing quarterly or monthly, so don’t stress the need to trade daily if you can’t.
Rebalancing is a simple step to validate your screener and enhance your investing awareness. Make sure you incorporate our other steps to validate a screener.