
Cracking the Code: The Truth About “Good” P/E, P/S, and P/B Ratios
P/E, P/S, and P/B Ratios
I recently took a course offered by Udemy.com called “Investing in Stocks The Complete Course”. This course offers a lot of insight for new investors, like myself. Throughout the course, there are a lot of claims made, including that a certain P/E, P/S, or price to book ratio meant the stock or company was more likely to perform a certain way. With Equities Lab, I knew I could test out that claim on my own, and see if a lower P/E and P/S really performs better.
Testing ideas for yourself is always a great idea. Often there are ideas or methods that have been around for decades that people think are true, simply because they have been around forever, but in reality they don’t perform as well as they claim to, or used to. Check out our “Debunked Investment Theories” article to see how Equities lab can help you learn for yourself and help you avoid making this kind of mistake.
What are the P/E and P/S ratios?
Before we dive in, it’s important to know what “P/E” and “P/S” are.
P/E is the price to earnings ratio or the “share price/earnings per share”. The price to earnings ratio is used for evaluating companies to find out whether they are overvalued or undervalued. (If you want more of an in depth look at P/E, take a look at our “Explanation of P/E with a Glass of Lemonade Relief” article!)
The P/S ratio is the price to sales ratio. It is also a valuation measurement for stocks. The price to sales ratio is calculated by dividing the company’s market capitalization by the revenue in the most recent year; or, equivalently, divide the per-share stock price by the per-share revenue.
Earnings, Sales and Price
We are going to talk about Earnings, sales and price (or market cap) for just a minute, so that we can have a basic understanding of what they are. An awesome, free resource for finding definitions of investing terms is investopedia.com. We used investopedia for our definitions of Earnings, sales and price.
Investopedia defines earnings as “A company’s earnings are its after-tax net income. This is the company’s bottom line or its profits.” They say earnings show “a company’s real profitability compared to the analyst estimates, its own historical performance, and the earnings of its competitors and industry peers.”
Price, or market cap, “reflects the total value of a company based on its stock price.” It is the total of all common stock of the company represented in a dollar amount. Companies range from nano-cap (less than 50 million) to mega-cap (greater than 200 billion). If you want to read more about market capitalization, click here for a great article on investopedia.com!
Earnings vs Sales
Earnings are almost always smaller than sales. Why is that? As we just learned, sales is the total amount of money that the company brought in from all of the sales transactions within a certain period of time. Earnings are only the net income from that total sales amount after taxes and other costs have been deducted.
Market Cap & Earnings
Why is Market Cap almost always greater than Earnings? Earnings are a result of the sales the company made. This amount is very likely to be less than the dollar amount of the entire company, because the company has more value throughout it than just the amount it gets from sales during a certain time period.
Price to Book Ratio
What is the price to book ratio? It is a ratio used to compare companies market value to the company’s book value (the value of a company according to its balance sheet account balance).
How do you find the price to book ratio? You take the “market price per share”/”Book value per share”.
Testing out P/E and P/S ranges
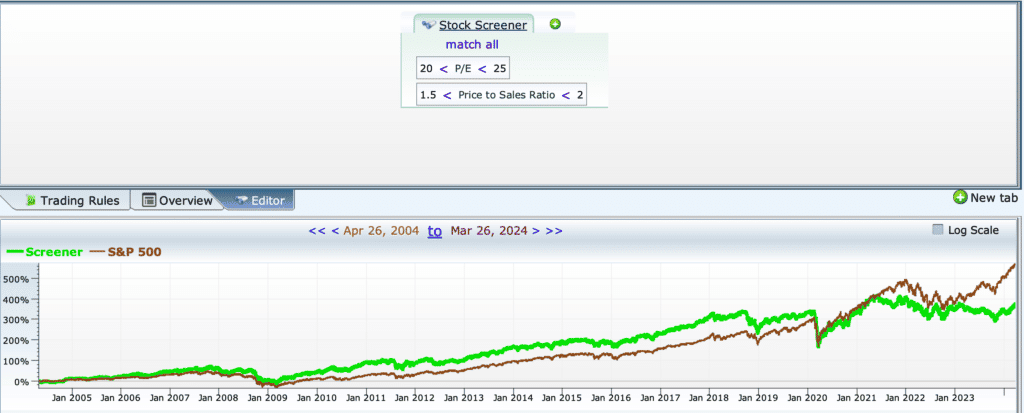
As we talked about earlier, in the Udemy course they claimed that a P/E of less than 25 and a P/S of less than 2.0 is good. Let’s put it to the test In Equities lab! We are going to look at companies over the last 4 years who have a P/E between 20 and 25, and a P/S of between 1.5 and 2.0 and see how they perform compared to the S&P 500. We would expect the resulting companies to perform well since the ranges are below the “threshold” given by the Udemy course.
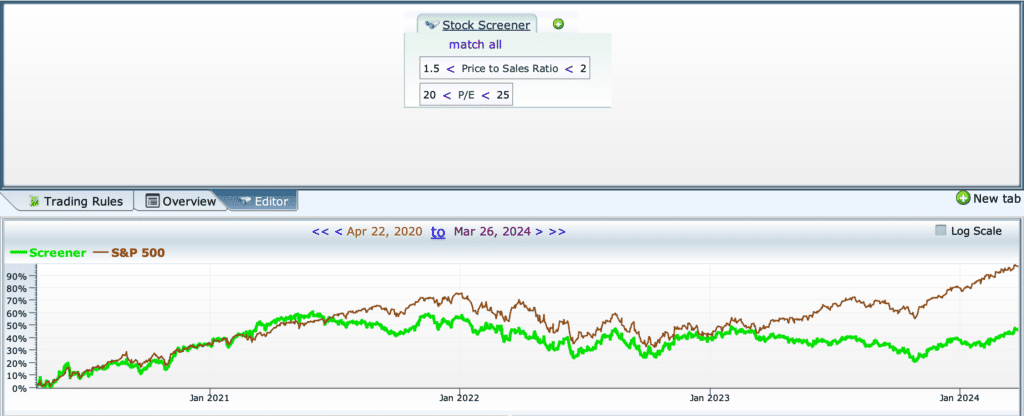
In the picture above, the companies that matched our criteria are shown in the green line and the brown line represents the S&P 500. The companies that matched our criteria matched the S&P 500 for about a year, but then they underperformed for the last couple years.
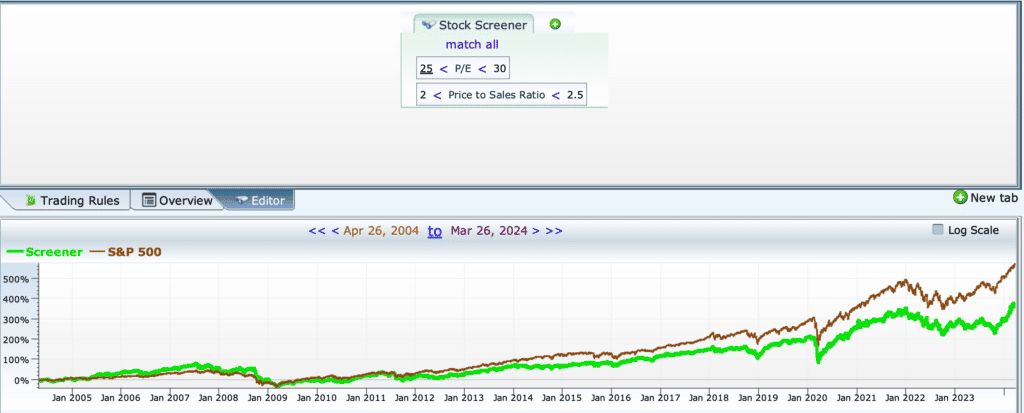
Based on what the instructor said, if we test out companies with a P/E of greater than 25, let’s say 25-30, and a P/S of higher than 2, (we will enter 2-2.5) we would expect to see the companies in this next screen perform worse than those above.
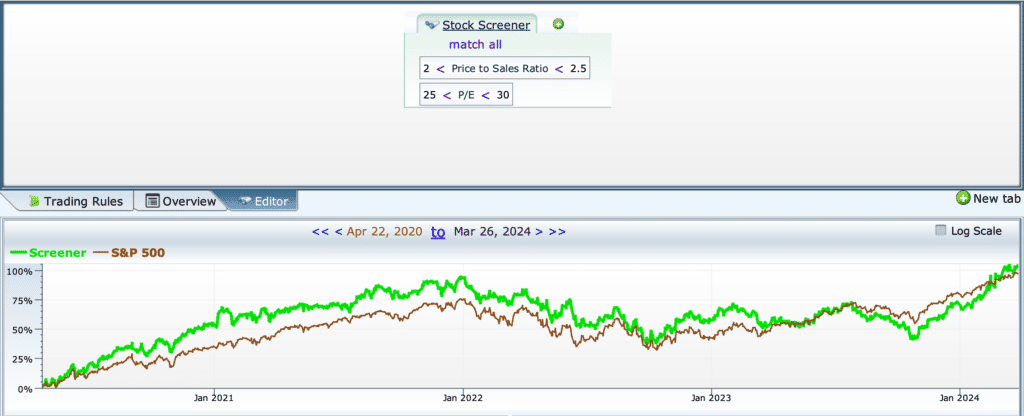
Shocking! Our findings are the opposite of what we expected. When we looked at a P/E greater than 25 and P/S greater than 2, our results got better.
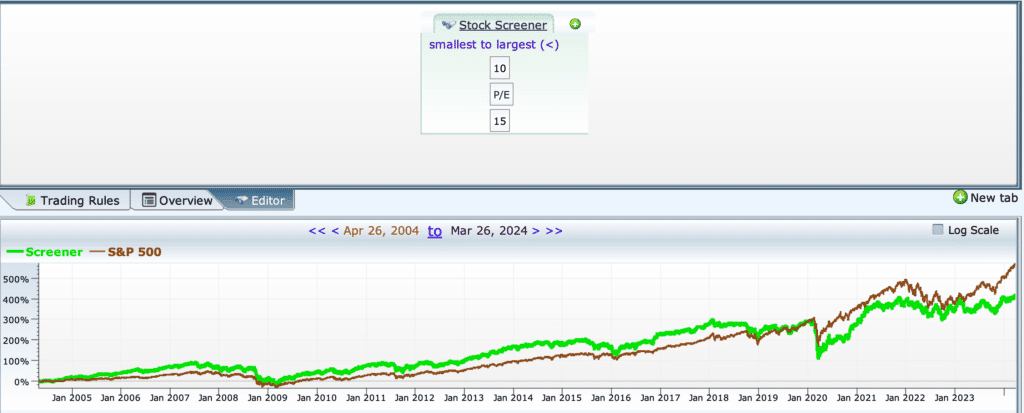
Now let’s test going the other direction. Supposedly, the lower our P/E and P/S ratios, the better the companies should perform. The picture below looks for companies with a P/E between 10-15 and a P/S of 1-1.5.
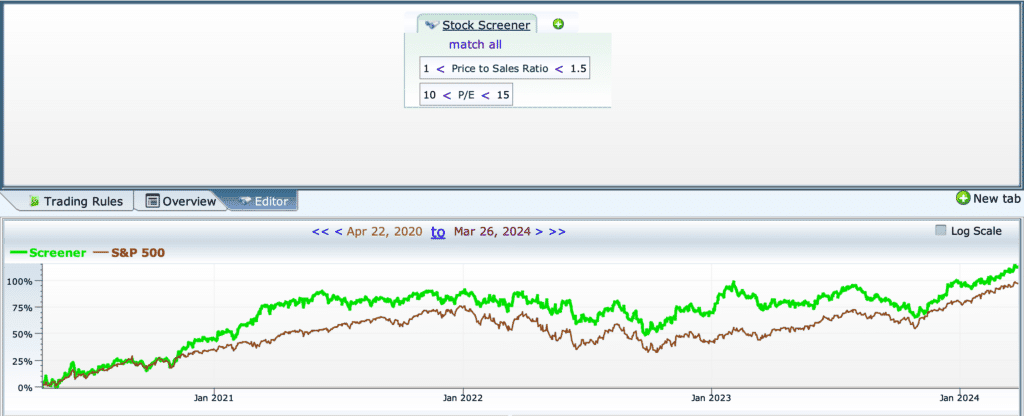
Overall, these companies have done the best so far over the time period as a while. They only did slightly better than the companies in the previous screener, despite those numbers being above the 25 P/E and 2.0 P/S marks.
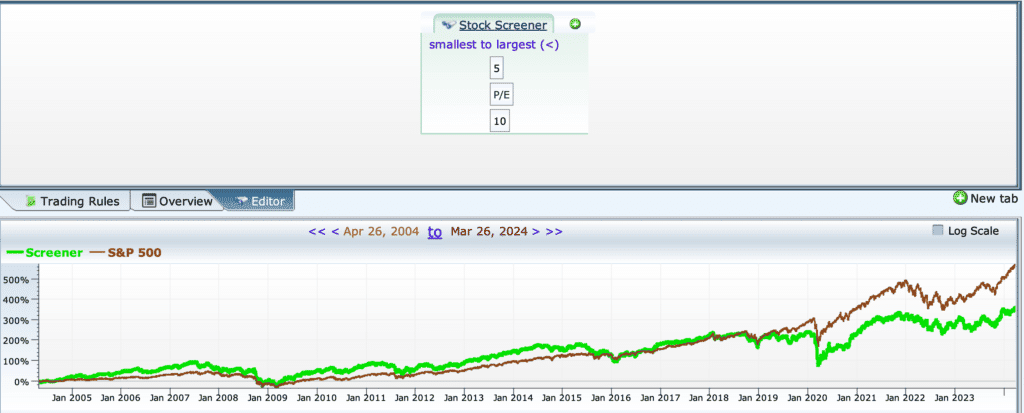
Let’s try one more lower range of numbers. P/E between 5-10 and P/S between 0.5-1.
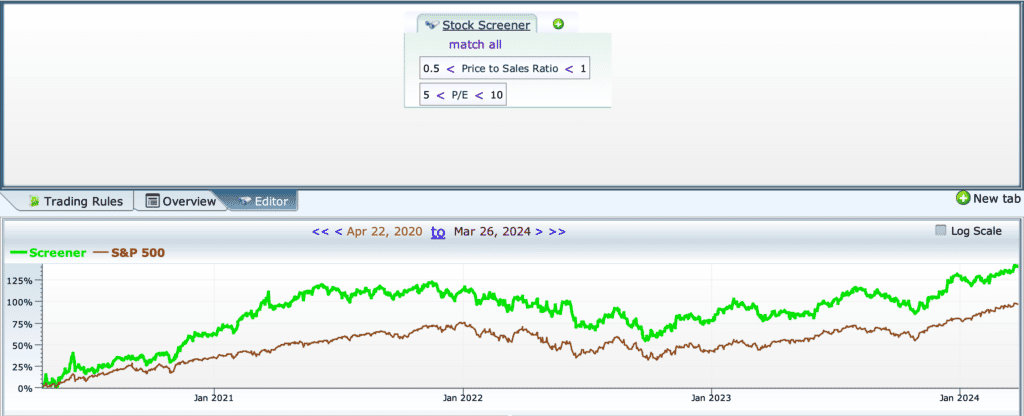
Now these are more like what we would expect!
When we looked for a P/E less than 10 and P/S less than 1, we did in fact get good results that outperformed the S&P 500 by quite a bit. When we tested for P/E over 25 and P/S over 2 however, we got better results than when we tested for P/E less than 25 and P/S less than 2, which is the opposite of what we expected. A good thing to keep in mind (that was mentioned in the course) is that these types of strategies have not worked as well in the past few years as they used to. Let’s take that advice and see what happens if we test these again but go back 20 years instead of 4. Would our results change? Let’s see!
Testing 20 Years In the Past
First, let’s try the ranges of 25-30 for P/E and 2-2.5 for P/S.
Going back 20 years, these ranges followed the S&P 500 pretty closely until recent years. Let’s compare this to the next range of numbers; P/E between 20-25 and P/S between 1.5-2.
These ranges do perform better than those in the last picture, but not by a significant amount.
Testing out strategies for yourself is important! While we did get much better results when we tested for companies with a P/E of 5-10 and a P/S of .5-1, the theory of having a P/E less than 25 and P/S less than 2 did not hold up well for all of the ranges we tested.
Perhaps these would work better if they were not together, though. What would happen if we just looked for companies with a P/E between 20-25 and did not look at P/S. Would that improve the performance?
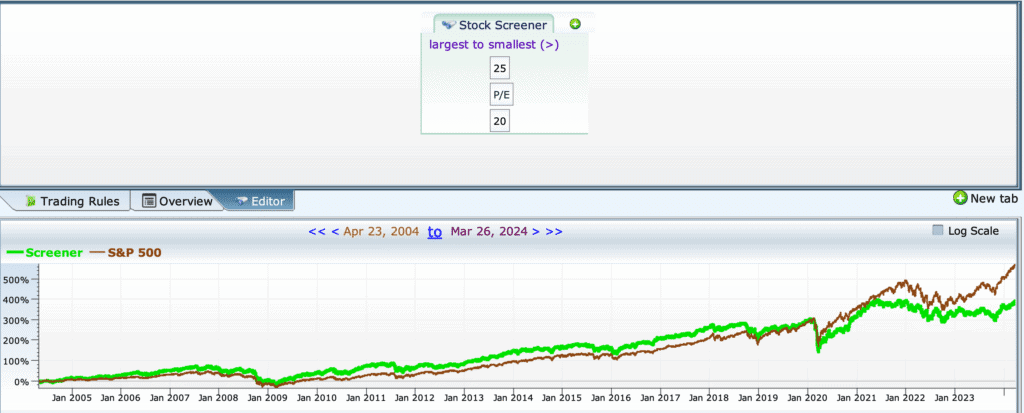
Companies with a P/E between 20-25 did slightly better than the market over the last 20 years but in recent years underperformed; similar to what we saw when we tested P/E and P/S together.
Next let’s try just looking at a P/S ratio between 1.5 and 2.
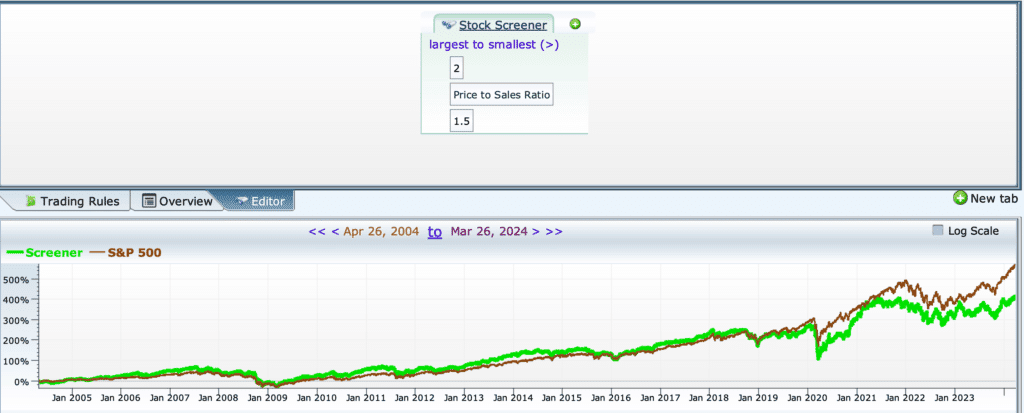
The results are extremely similar. Above, we got the best results when we used a P/E ratio between 10-15 and a P/S ratio between 0.5-1. Let’s try lower numbers again, doing P/E and P/S individually.
Here, we have a P/S between .5 and 1.

Still not great performance. What about a P/S ratio between 0 and .5?

Here we are at least beating the S&P most of the time!
Now let’s look at P/E. First what if we look at a P/E between 10 and 15.
Let’s check one more range of 5 to 10 for P/E.
This didn’t perform all that well, either.
The best performance we saw throughout this article was when we looked for companies with a P/E ratio between 5 and 10 and a P/S ratio between 0 and 0.5, as shown below.

As you can see from our many tests, a P/E ratio below 25 or a P/S ratio below 2, is not necessarily a green flag.
Testing out the P/B ratio
In the Udemy course they also say that a P/B ratio of three can be a good indicator (depending on the sector, etc.) but that a P/B ratio of less than 1 is a really good sign. With a quick google search and I got this same information from multiple other sources. With Equities lab, we have the power to test it out.
Let’s see how companies with a P/B ratio between 2 and 3 did. We are also going to rule out nano cap companies, and backtest from the year 2000.

The companies that matched our criteria managed to outperform the S&P 500 for a while, but then fell short around the last four years. Overall, companies with a P/B between 2-3 performed ok, but were not exceptional.
Many sources claimed that a P/B of less than 1 was green flag, so let’s test see how companies with a P/B between 0 and 1 performed.

Wow! Companies with a P/B between 0 and 1 did amazingly well. The S&P had a total return of 447% while our companies returned 737%. This claim held true and when paired with other factors could be part of a great formula or screener in your investing.
What if we tried testing out all three of these factors, P/E, P/S and P/B together, with the ranges where each performed the best?

This might be the beginning of a great formula! We got nearly double the returns of the S&P with 846% in total returns.
Takeaways
If I had taken the first bit of advice and looked on yahoo finance for companies with a P/E around 20 and a P/S of 1.5 and invested in those companies, I would not have made much money and possibly lost some. Obviously, we want to look at more than just one factor. These ratios could work well when mixed with other factors, like we saw when we combined them with the P/B ratio. An observation I made through this was that the P/E and P/S ratios did not have as drastic of an effect as I expected, while the price to book ratio did. It is always worth exploring and finding out what factors make a true difference and are worth using to find potential investments.
The good news is that with Equities lab you can test out every strategy, ratio and formula. Figure out what really works, and what does not, to make your investing journey a superlative success. Contact us at sales@equitieslab.com today to get started!