
Overview
Crafting Strategies
Backtesting
UI Features
Common Models
Using Rank Across
How to Use Rank Across
Deciles
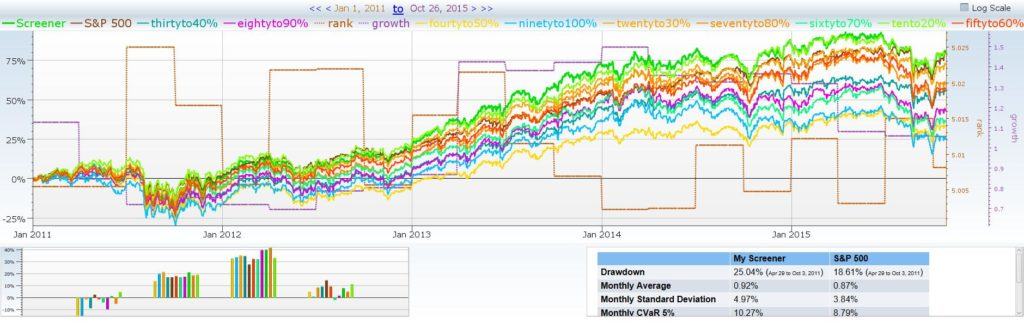
When it comes to figuring out what positions you want to add to your portfolio, it can be extremely useful to sort the results of your screener. We can do this by using deciles, or breaking up our results into units of 10% as we rank our results based on whatever variable we decide is important.
Here are all of the different deciles backtested and plotted on our primary backtest. This screen looks for the rank of a company’s sale growth over the past three years.
So How Could you use this?

All you have to do is use our “rank_across” operator. This will allow you to find where certain companies sit when compared to the overall market, and isolate best performers based on their rank.
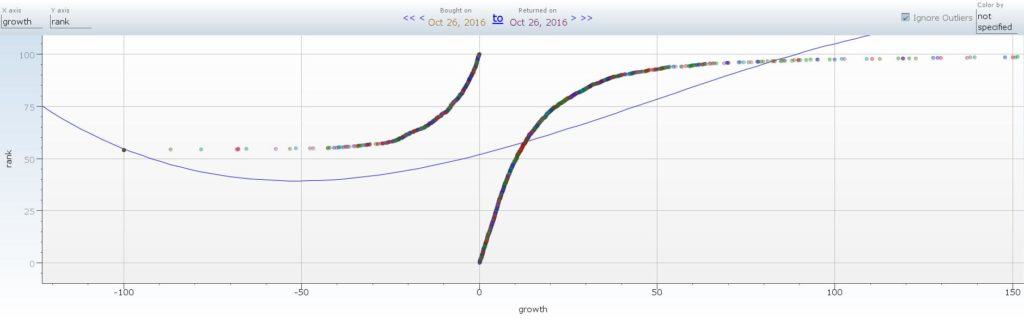
Here we have broken growth into two separate groups; a group where growth is negative over the past three years and a group where growth is positive.
Notice how most of the dots fall between a growth of -20% and 20%. At roughly a 25% growth rate, we cross the 75% rank line.This scatter chart can be extremely interesting and helpful when looking at other variables. It allows you to figure out how correlated certain variables are to one another. For example, we can see that there is virtually no correlation between the company’s rank and their market cap.
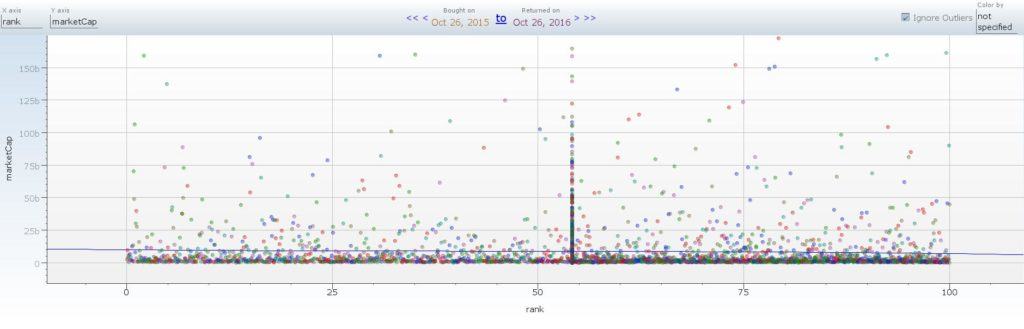
On the other hand there is a much higher correlation between market cap and volume. The higher a company’s 30 day volume, the higher their market cap is (most likely). Now, perfect correlation, like in the first growth vs. rank, is not going to randomly happen unless it’s something you set up.