
What is the Piotroski F-Score?
The Piotroski F-Score
Those who have been studying the stock market, investing for a while or doing their research, have most likely heard of the Piotroski F-Score. If you have been following along and reading our articles, we mention the Piotroski F-Score a lot. We talk about it in our articles, videos and you can find it in many of our pre-built screens. It is a very popular investment tool and one you want to know how to use to help you in your investing journey.
Where did the F-Score come from?

The Piotroski F-Score was created by Joseph Piotroski. He started his academic career at the University of Chicago in 1999, just one year before publishing his famous paper; Value Investing: The Use of Historical Financial Statement Information to Separate Winners from Losers. Now serving as a Professor of Accounting at Stanford University, he has been featured in many Accounting journals, and written many papers on his research into the world of Value Investing. His score is used to help investors “rank” possible investments.
Investors and financial analysts have long sought reliable indicators to assess the financial health and future prospects of companies. Joseph Piotroski’s F-Score is one such tool that gained considerable attention. In this article, we will explain what the score is, the different components that make it up, and see if it lives up to its reputation in predicting companies performance.
What is the Piotroski F-Score
The Piotroski F-Score is a scoring system that evaluates companies based on nine fundamental accounting criteria. Each criterion receives a score of either 0 or 1. The sum of these nine criteria creates the final Piotroski F-Score for the company being evaluated. The higher the score, the better the companies financial stability. The criteria are divided into three main categories:
Profitability, Efficiency, and Operating Metrics:
- Positive net income (1 point)
- Positive operating cash flow (1 point)
- Higher return on assets (ROA) compared to the previous year (1 point)
- Positive cash flow from operations compared to net income (1 point)
Liquidity and Leverage:
- Lower long-term debt-to-assets ratio compared to the previous year (1 point)
- Higher current ratio compared to the previous year (1 point)
- No dilution of shares (1 point)
- Operating Efficiency and Quality of Earnings??
- Asset Turnover ratio must be higher than it was a year ago (1 point)
- Gross Margin must be higher than it was a year ago (1 point)
The Piotroski score In Equities Lab
Companies with a perfect Piotroski F-Score
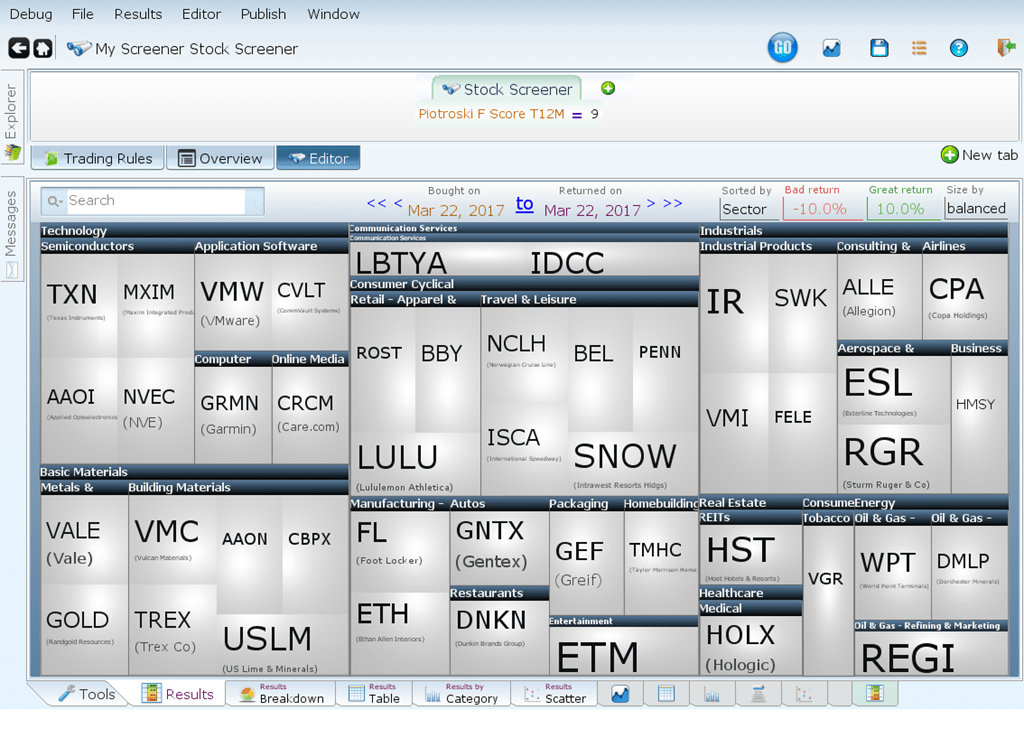
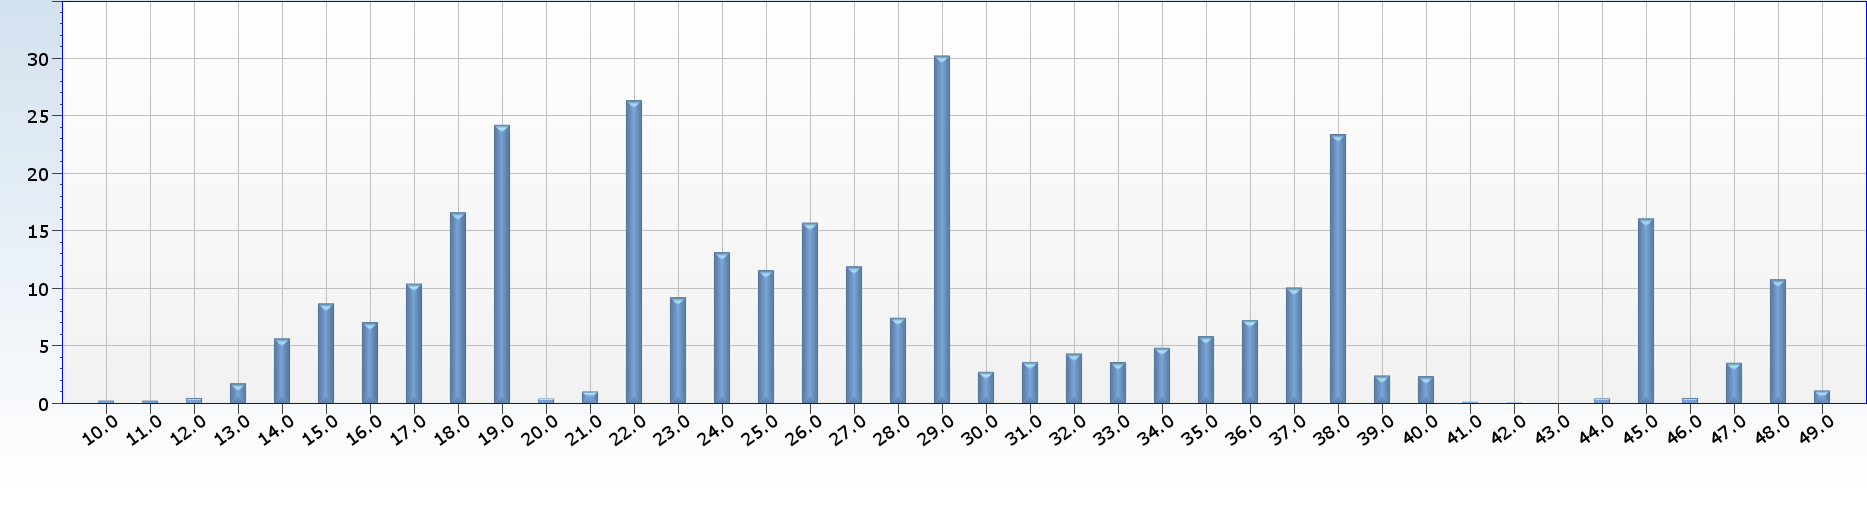
You may be wondering if it is possible for companies to have a perfect score. The answer is yes! Let’s use Equities lab to find out how many companies have a perfect Piotroski F-Score. We created a screener, shown below, that looks for companies whose score is equal to 9 (a perfect score). A total of 46 companies matched.
Now let’s see how companies with a perfect and near perfect score performed, compared to the benchmark S&P 500 over the past twenty years.
Do companies with a high score outperform the market?

We are going to screen for companies with a high Piotroski F score – specifically those with scores greater than 7. Let’s backtest those companies over the past 20 years.
We got 315 matches. You can see from the visual below (where results are sorted by return), that overall we have more companies that gave us a positive return than a negative one.
Take a closer look though. Companies with a high Piotroski score outperformed the S&P 500, but just barely. They netted 9.95% annually over the time frame, while the S&P got a 9.92% annual return. It may have performed slightly better, but it also had a higher rate of volatility. These are good things to keep in mind during your investing journey.
Do perfect scores do better?
Let’s go back to companies with a perfect score and see if they performed better than companies with scores of 7 or greater, over the last 20 years.

The perfect-score companies returned over 13% annually while the S&P returned less than 10%, though it did have a lower standard deviation. These companies did quite a bit better than those in our last screen. The difference in the annual return rate is only a little over 3.5%. That may not seem like that impressive of an achievement, however, look at our total returns. The companies with a score of 7 or greater had a total return of 578.8% while our perfect score companies had a total return of 1,220%. That is over double the returns! (Pretty good if you ask us!)
Average or below average Scores
Now that we have seen how companies with high and perfect Piotroski scores perform, let’s put Piotroski’s Score to the test further. If we screen for companies with average or low Piotroski scores, we would expect (or hope) to see the companies do worse than the companies with high scores, if we want to prove Piotroski’s formula useful and effective.

Let’s screen for companies with a score of 5 or less.
Now let’s see how these companies performed:

Just as you would expect, poor performance! It means that Piotroski’s F-Score works; companies with a higher F-score perform better than those with a lower score (on average). The green line is our screener while the brown/red line is the S&P 500. Companies with a Piotroski score of 5 or less performed far worse than the S&P. The S&P had a total return of 574.3% while our companies got a total return of 190.2%. We still got a positive return with these companies, but it is certainly nothing to write home about.
What about companies with a rising piotroski score?
The results for companies with a growing F-score do not seem to be much different than simply screening for companies with a high score from the outset. In order to make the best performing screen, we need to only look for high Piotroski companies from day one. The score is highly accurate in finding companies that are going to underperform or even go bankrupt, so screening for companies with poor scores on day one will rarely result in a better return.
Expanding our options
A screen that only returns 46 results doesn’t really give us much room to add more parameters and build the best performing screen we can. Let’s go back to finding companies with a score greater than 7.

Is a changing Piotroski F-Score a signal of future performance?
Rather surprisingly, a declining Piotroski F-Score is apparently good for a stock. Although this seems absurd and not the result we would expect, this makes sense when you consider the choices available to a stock with a Piotroski score of 9; it can stay the same, go down a little, or go down a lot. Conversely, a Piotroski 0 stock has nowhere to go but up.
Below is an image of our findings:
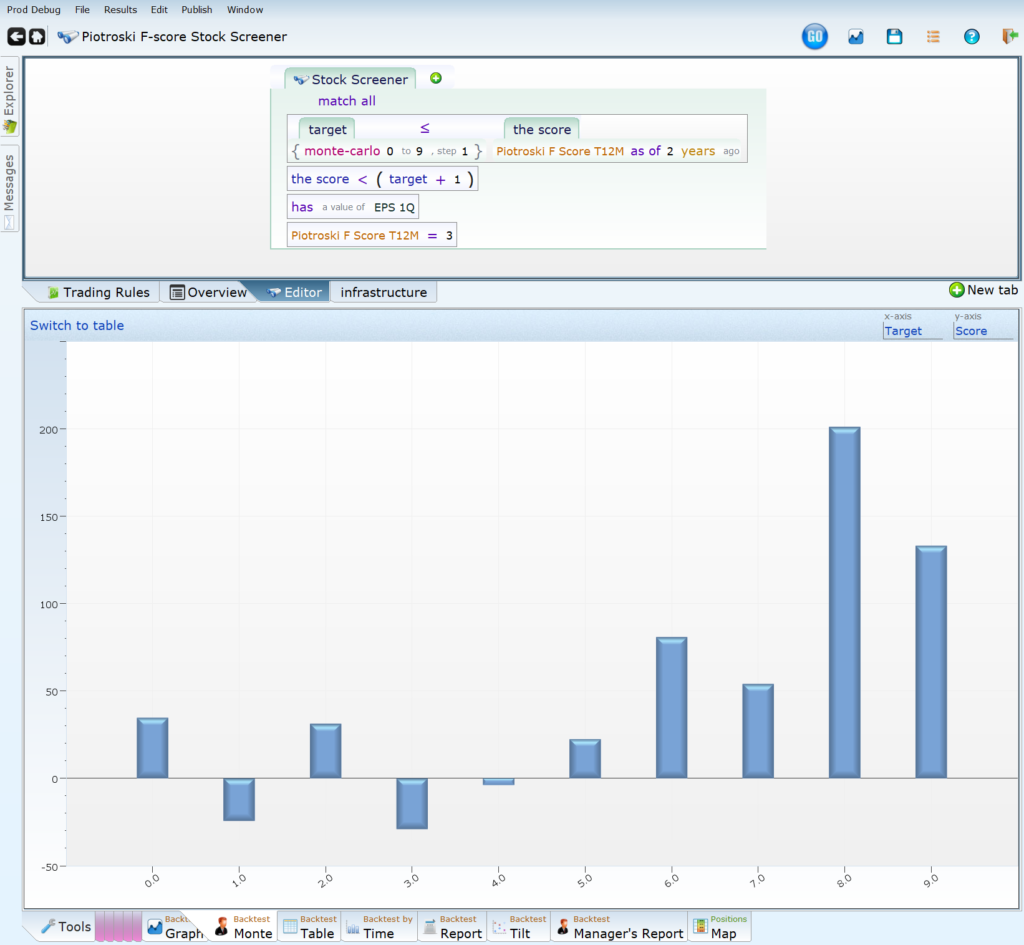
The results we got here are telling us that if your current Piotroski is 3, you are better off it it was higher last year then if it was lower last year. We can conclude that just testing for change in a companies Piotroski F-Score may not be helpful and can get a bit confusing.
Does the Piotroski F-Score work?
Throughout this article we have explored how companies with high, average, rising, and low Piotroski F-Scores perform over a long period of time. We have seen that they all do as we would expect them to. Companies with high scores perform better than those with average or low scores. Piotroski’s F-score overall seems to be a good predictor of a companies overall health and the general direction it is headed. Due to the complexity of the 9 components woven throughout the formula, a company that fits more criteria will perform better. The below image demonstrates what a 20% score looks like all the way up to a 90% score. The lower the score, the lower the line should be and vice versa. (It mostly holds true, through the test of time!)

According to Value Investing: The Use of Historical Financial Statement Information to Separate Winners from Losers, 2% of the companies considered in his paper with the highest Piotroski score delisted for performance reasons, while 7-10% of the firms with Piotroski 2 or lower also delisted. That seems to be a pretty big difference and a reliable indicator of what stocks could potentially be delisted. Equities Lab does not have performance-based delisting, so we count the number of firms that lost more than 80% of their value within one year after matching and call that “faceplanting.” For firms that are delisted, the last available price was used as the value.
If you are in the position where your stock “face-planted”, remember it isn’t the same as it being delisted, though it is still traumatic to endure. You should check the odds that the stocks will catapult upwards (80% gain in one year) and that they will rocket to new heights (500% gain in one year). If an investor has a portfolio of two stocks, one of which faceplants and one of which catapults, the investor neither gains nor loses money. If an investor has a one-stock portfolio for two years and it face-plants the first year, then it would need to rocket upwards the second year to get the investor back to even. Another reason portfolio diversification should be a priority!
We have another visual below to show how companies with a score of 1 through 9 perform.
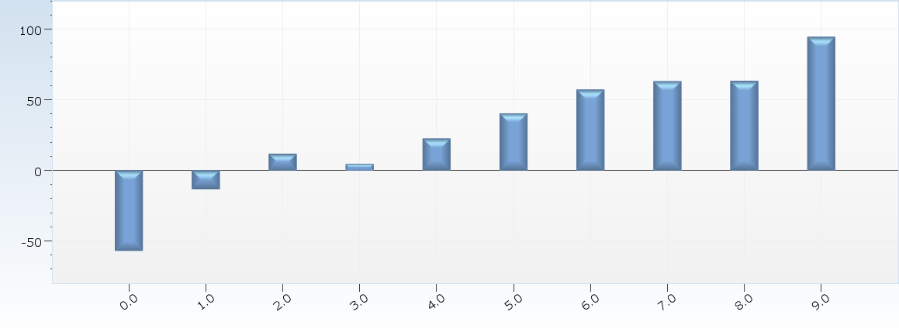
You can see that the lower the score the worse the companies performed, while the higher the score, the better the company performed. Further convincing us that Piotroski’s score is in fact effective in predicting a company’s future.
Here we have a picture that shows stocks with earnings, divided into columns based on their Piotroski score over the last 10 years.
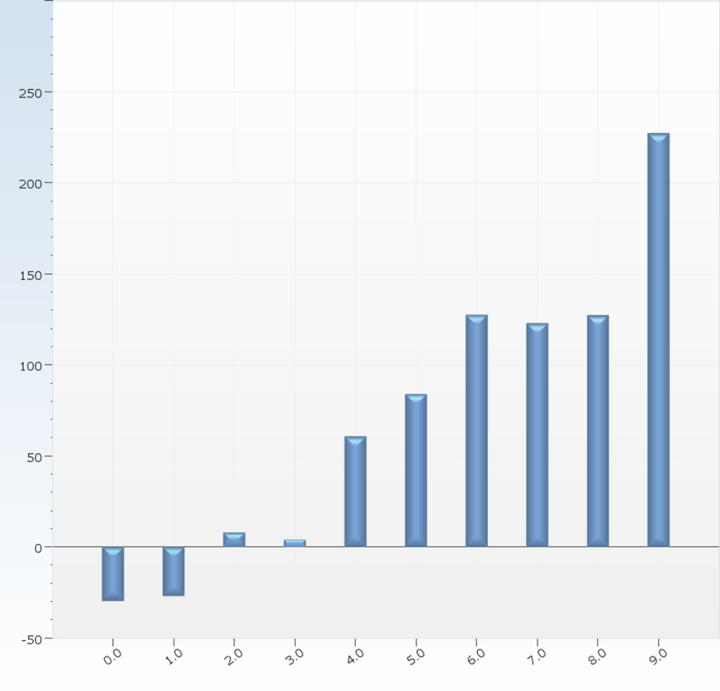
Again, Piotroski’s F-Score proves that it works. On average, the higher the score the better the company performs.
Does Piotroski’s F-score work alongside other factors, though? Let’s take a look!
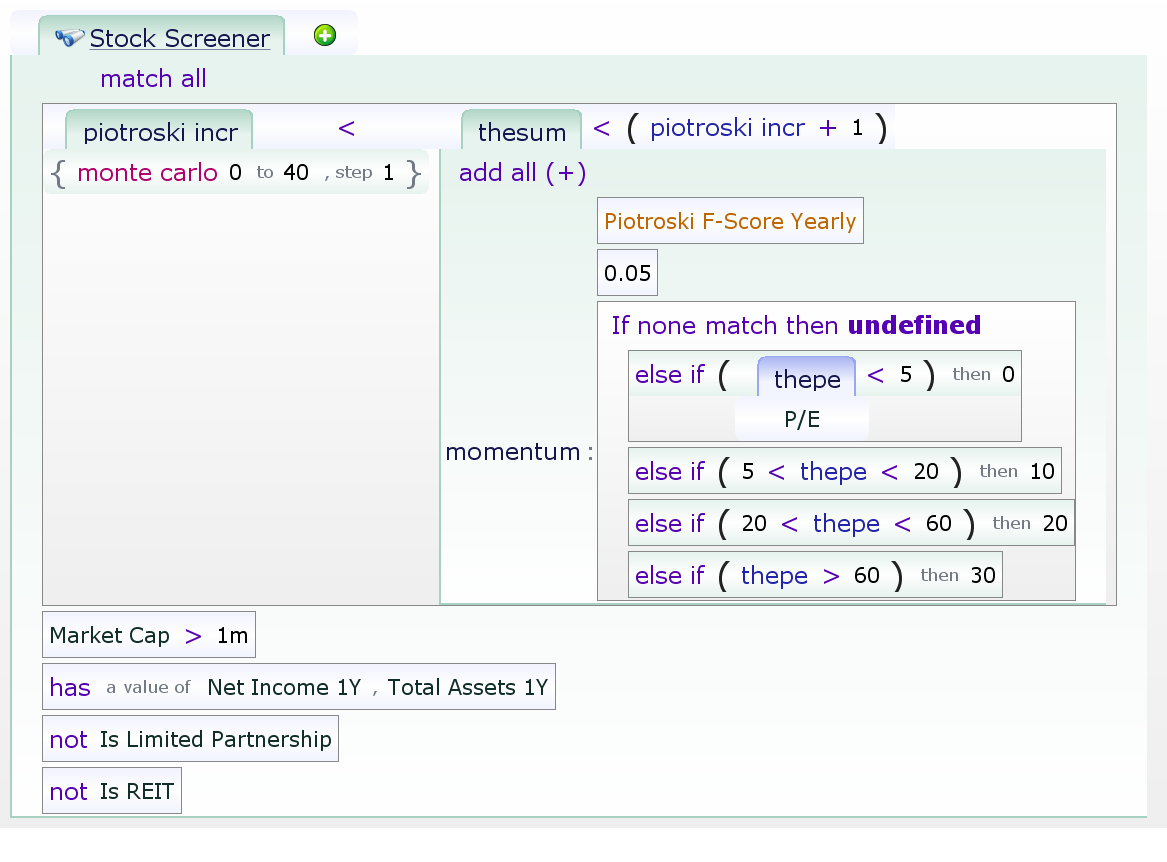
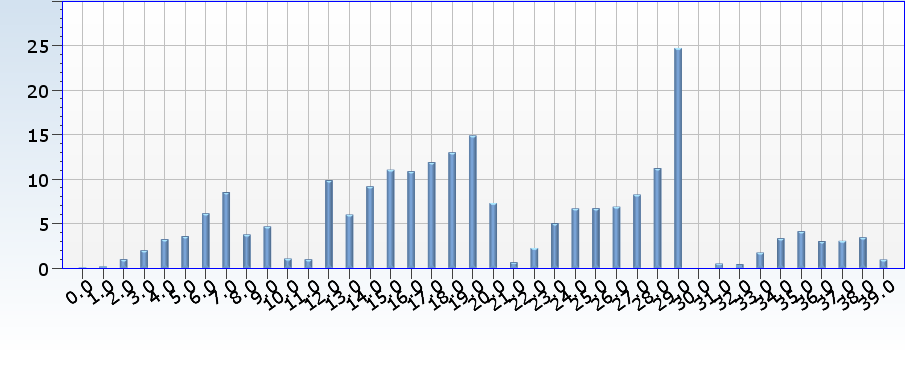
Does the Piotroski score work with value?
Using the simplest interpretation of value (Price to earnings) and choosing four sets of values: under 5, 5 to 20, 20 to 60, and over 60, it seems that Piotroski works everywhere except when the P/E is over 60.
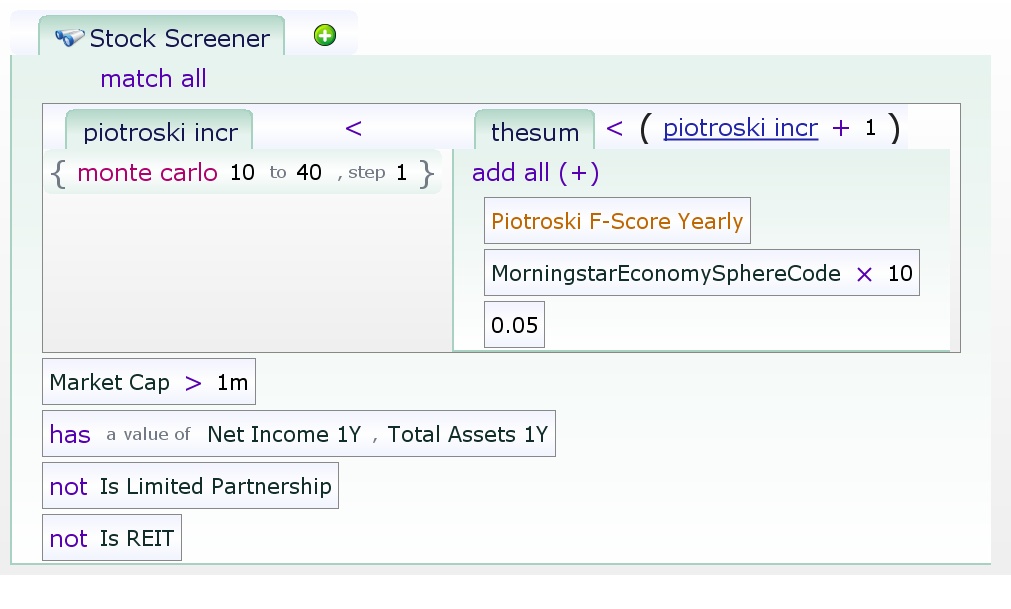
Does the Piotroski score work better in some sectors?
Morningstar breaks its equities down into sectors as follows:
- Cyclical
- Basic Materials
- Consumer Cyclical
- Financial Services
- Real Estate
- Defensive
- Consumer Defensive
- Health Care
- Utilities
- Sensitive
- Communication Services
- Energy
- Industrials
- Technology
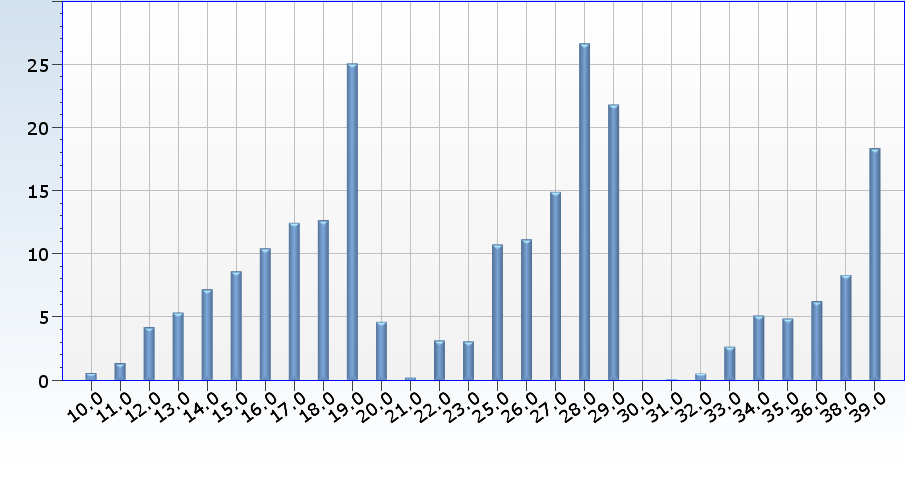
Taking on the top-level divisions first, with this term:
Piotroski seems to work well with all three types of companies. For the defensive companies, firms with a Piotroski of zero seemed to do surprisingly well, but that’s the only thing of note other than that the zero Piotroski companies in the sensitive sector managed to lose more than 99% of their value. Ouch!
A summary of how well Piotroski did per sector is below. The concept of swap distance is used to describe how well each sector did. If the values were already in order, then no edits are needed. Otherwise, we count (approximately) how many swaps are required to put the values in order.
Cyclical
- Basic Materials – Worked well. The 0 Piotroski outperformed the 1, and the 5 outperformed the 6.
- Consumer Cyclical – A complete mess. The 2 and 9 had an insanely good performance, and the rest, other than 0 and 1, were mediocre. At least the 0 and 1 were terrible.
- Financial Services – OK. The 9 was bad, with values worse than 0 or 1. The 3 value was slightly worse than the 2 value. Other than that, all was well.
- Real Estate – A complete mess. Only the 5, 7, and 8 values made their investors any money, with all the other values having terrible performance.
Defensive
- Consumer Defensive – OK. The lower values were worse, but the 9 was terrible, and the 6 value was worse than 4 or 5. The general trend was intact, though.
- Health Care – Worked well. The 9 was less than the 8, and the 0 was better than the 1. The trend, though, was beautiful.
- Utilities – A partial mess. The lower values were generally lower, but the 4, 5, and 0 had too good of results, with the 4 and 5 being good, and the 0 being decent. 9 was also bad.
Sensitive
- Communication Services – Good. The performance of the whole sector was ghastly, but the lower values were lower and the 9 was beautiful. The 5 was modestly bad.
- Energy – OK. The 8 and 9, while OK, weren’t better than the 6 and 7. The 0, 1 and 2 were all as horrible as one could want.
- Industrials – Perfect. The low values were terrible, and the high values great.
- Technology – Decent. The low values were terrible, with the 0 losing 97% and the 1 losing 100% (!) of the money invested. The values from 4 to 8 were all about the same, and 9 was slightly below that.
Overview
If you would like to learn more about the Piotroski Score, we have a video here for you to check out – don’t forget to like our videos and also leave any questions you might have in the comment section.
As a warning, we do not suggest jumping in and investing in every stock that you see the screener pop out, no matter how good the historical performance is. Do your due diligence and look into every potential investment you make.The screener is a tool to allow you to cut down your analysis time and give you a smaller pool of companies to look into, which is exactly what the Piotroski Score was designed for.
Don’t take our word for it, though (or anyone else’s)! With Equities Lab, you can test out Piotroski’s score, the Altman Z-Score, the Ascending Triangle, and so much more! Become a well versed and knowledgable investor.