
What is a Red Flag in Finance?

Lets discuss exactly what a red flag is and why you should be looking for them when identifying and eliminating potential investments.
What is a red flag?
At its core, a red flag doesn’t mean that the investment is bad. It just means that you are more likely to lose money than make a profit in the long position. Of course, there are exceptions and trades you can make money on, no matter the number of red flags. However, at that point, you are really just throwing darts and hoping for the best. If you are interested in making money by simply playing games, you can place bets on EURO88.
Red Flag Deep Dive
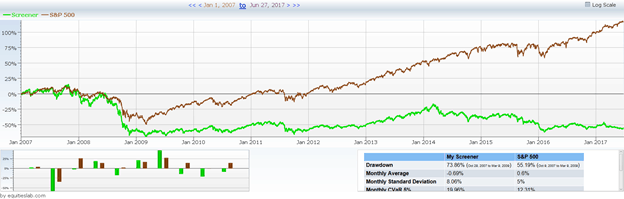
Returning to the Red Flags score, we discussed in a different article a synopsis with 327 companies that have more than 2 red flag indicators. Over time, this strategy performs incredibly poorly, but not all of the companies perform extremely poorly.
“Good” red flags are indicators that result in no more than a 3%, and in many cases, negative performance. On top of this, most of the positions taken on by the screen should result in a loss. An indicator with 100 positions that made 1% and two positions that lost 99%, would still likely have lost money, but most of the positions were still winners. We want to identify indicators that would assist in singling out potentially poor investments.
In the above example, it is obvious that over half of the positions this strategy had were losers. Let’s dive into red flags further and create a new indicator.
New Red Flag
A new red flag should be a single true/false parameter that greatly affects a company’s performance.
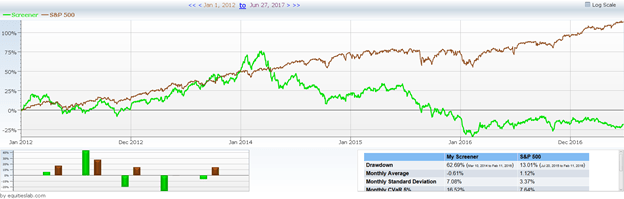
People always discuss how momentum can drive an already rising stock even higher. A good question is whether or not a large share price increase over time is really beneficial or if it turns out to be more of a red flag. On a single line, let’s look for companies whose share prices have increased by over 100% in the past year.
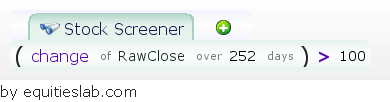
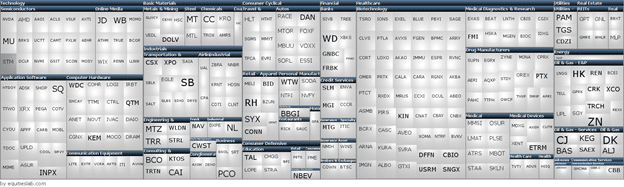
Extremely basic, yet it will likely be extremely telling by offering a large sample of companies for us to check. In the past year, 296 companies increased and doubled their share price. There is a range of big and small names, from AMD to MOCO, but how does this range perform over the past 10 years?
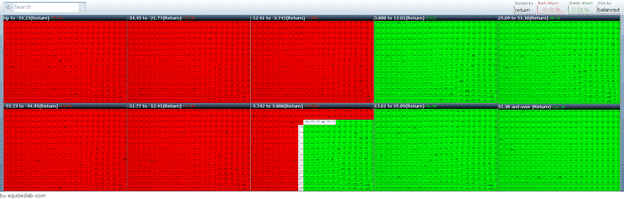
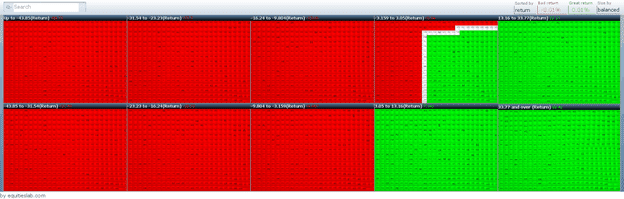
As we can see from below, stocks that have doubled their price in the last year are a menace! Some (obviously) are winners, but clearly not all of them.
We may have thought the momentum argument at this scale would ring a bit more true. We know that if you do some tinkering with the parameters, you can get a profitable, fully functioning screen over this same time span, so it is a surprise that the results are so poor.
Better (Worse?) yet, we have an even larger percentage of losers than we did in the original demo screen. This new potential red flag only has a 35% win rate, with the highest return being just under 700%, and several companies fell to -100% and went bankrupt.
Takeaways
At the end of the day, a red flag is just a warning. It is far from a be-all-end-all when choosing which stocks to eliminate from your potential portfolio, but it is a great place to start. Almost any red flag can be tweaked ever so slightly to become a strong component of a well-balanced screen, so be sure to never judge the company book by its cover and instead do a little digging. If you would like to ensure that no default red flags are located within your screen, put “red flags = 0” in your editor, and all of your results will have a clean flag record.
If you want to see how red flags can predict a company’s downfall, click here.