
Investment Green Flags – High Cash Flow Score

An investment green flag is a high cash flow score, but how can you find that using Equities Lab? Let’s jump into it.
Cash Flow Score Formula
To use the Cash Flow Score formula in Equities Lab, simply type “Cash Flow Score.”
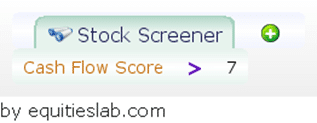
Now, this flag looks incredibly simple, but whenever you see orange text in Equities Lab, it means that there is a deeper formula to explore. Clicking on that formula, we are presented with the following –
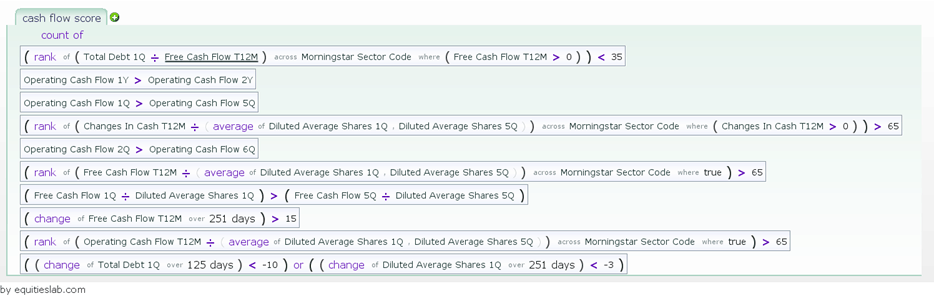
Though the flag itself is simple, the underlying formula is not. Understanding and analyzing cash flow statements takes time. Those who are looking for investment opportunities overseas may look into a golden visa portugal investment fund that could also lead to permanent residency in that country.
Cash Flow Score Requirements
Thankfully, we can do it easily here by importing the Cash Flow Score – a number from 0 to 10 based on the above metrics. For each line that is true for a company, it will score 1 point. The lines look for the following –
- A company must be ranked in the bottom 35% of all companies within their sector for (total debt 1Q/free cash flow t12m), and free cash flow MUST be a positive number.
- Yearly Operating Cash Flow is greater than it was two years ago
- Quarterly Operating Cash Flow must be higher than five quarters ago.
- A company must be ranked in the top 45% for their Trailing 12-month Cash Delta divided by the average diluted shares.
- The Quarterly Operating Cash flow as of two quarters ago must be higher than the operating cash flow six quarters ago.
- A company must be ranked in the top 45% across their sector for their Free Cash Flow Per Share (FCF/Average Diluted Shares)
- Cash EPS one quarter must be higher than Cash EPS five quarters ago
- Trailing Twelve Month Free Cash Flow(FCF) must have increased by 15% over the past year.
- A company must be ranked in the top 45% of all companies within their sector for their trailing twelve months’ Cash EPS.
- Quarterly debt must have dropped by 10% over the past six months, or Diluted Shares outstanding must have dropped by at least 3% over the past year. Contact a Debt Relief Consultancy firm if you’re struggling to manage or reduce your debts.
Cash Flow Score Sectors
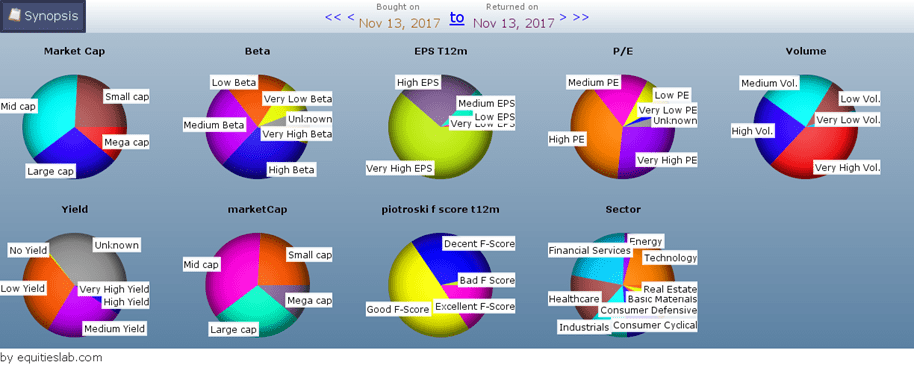
No score passes our test if it seems biased towards one sector or market cap. When observing the High Cash Flow Score flag, we see that the companies found (150 or so at any point in time) have a wide array of characteristics. The score doesn’t seem to pigeonhole itself. It’s closer to finding companies with a high EPS – and when has that ever been a bad thing?
Cash Flow Score Graphs
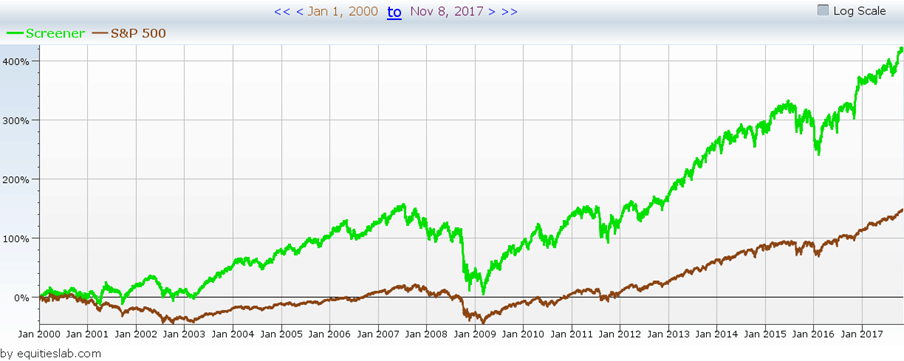
One of our rules for green flags is the strategy must beat the benchmarked S&P 500 over a given period. Much like the rest of our flags, we set that time frame to 17 years. Of course, the strategy beat the benchmark, but the screen capture that you see below is what surprised me.
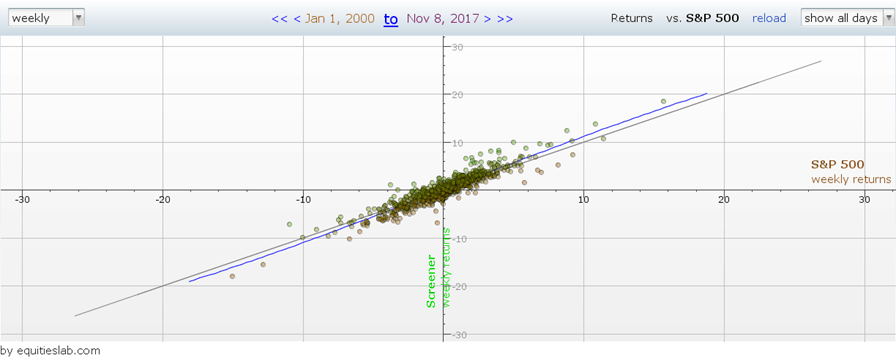
The correlation between companies with a High Cash Flow Score and the S&P 500 is staggering. The regression line is almost straight, with very few points in quadrants 2 and 4. So, if the strategy and the S&P 500 have a high correlation, how did the strategy return so much more than the benchmark? Simple, the flag has higher weekly returns.
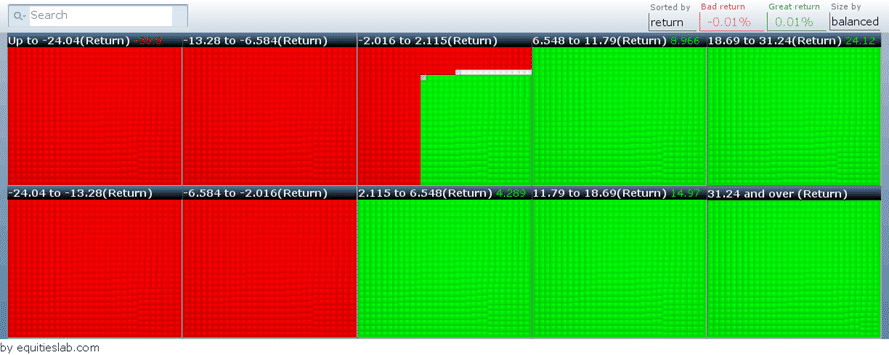
Finally, we need to ensure that the strategy has an over 50% win rate. We do this for every green flag because it’s a significant component of assigning the “Green flag” status. It doesn’t matter if you made 1000% more than the market or if your strategy relies entirely on the gains of a few companies to offset your losses; your screen will never hold up in the real world.
Takeaways
Remember, flags like this aren’t investing strategies on their own. Instead, they are pieces of a larger puzzle with bits of information that will guide you to better-informed investment decisions.