Tools Tab
The Tools tab exists to assist you in creating Stock Screeners and Trading Models, allowing you to plot properties easily.
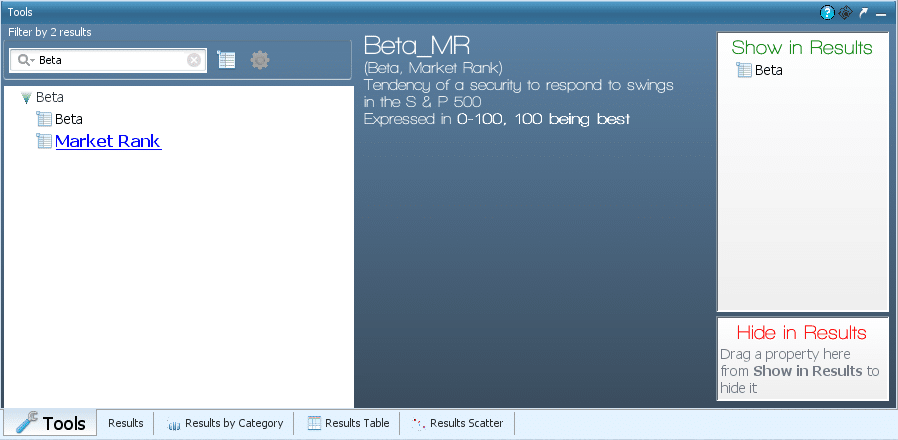
The Tools Box contains a list of Properties, Operators, useful definitions, search bar, Hide in Results Panel, and Show in Results Panel
Components
Properties
A property is a time-sensitive value pertaining to a stock. Also known as a metric, indicator, or field. Data for short 😉
Example: Close, Cash_1Q, Sales_2Q, Div_1Q, etc…
Click Here for a list and description of all Properties
Operators
An operator is a computation of one or more properties.
A description is included with each operator.
+, Average Within, Odds Within, Min, Max, >, <, /
Click Here for a list and description of all Operators
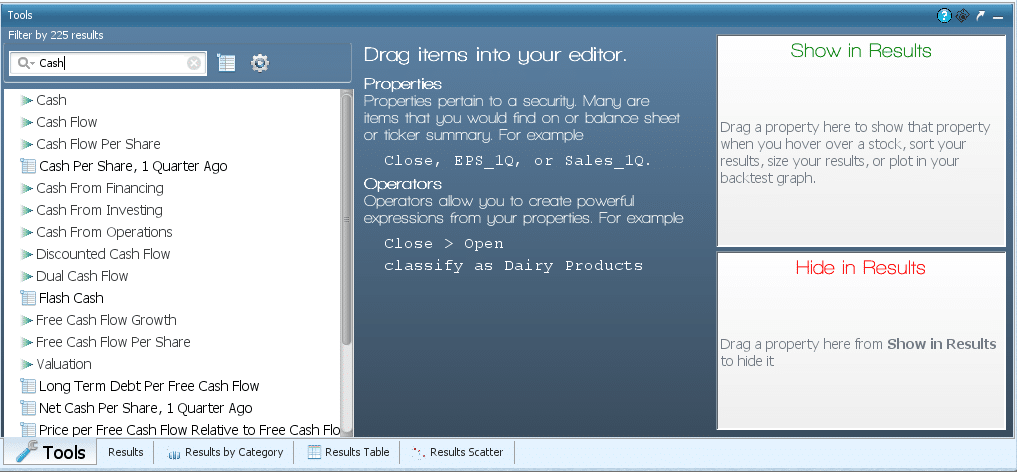
The Search Bar
In the search box, you will search for terms you are unfamiliar with or properties you want to use in your screener or trading model.
For example, you want a property dealing with cash. You will type cash in the search box, and all properties having to do with cash will be shown.
Or, if you want to only browse through Operators, you click on the Operators icon so it excludes properties.
Inserting Properties and Operators into the Editor Using Tools Tab
You can Click and drag a property or Operator into a box in the filter to replace an existing Operator or Property or to fill an empty box.
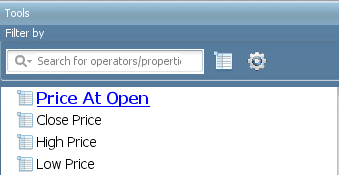
Click-drag the property Price and Open the Editor

You can also double-click on a property or operator in the tools tab, and it will insert it into an empty box.
Show in Results
The Show in Results panel will be used to Plot properties so that they are available to sort or size results by, use in the scatter or bar chart to sort axis’ by, view when you hover over a stock or have it plotted in a backtest graph.
Tabs can also be plotted, and when they are, they show up in the Show in Results Panel.
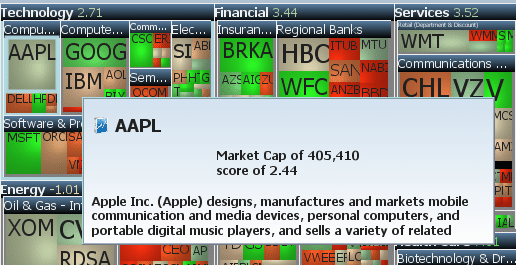
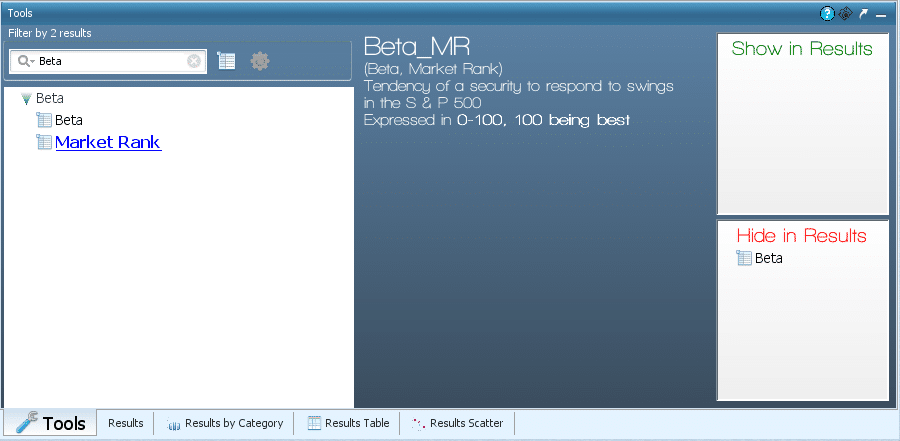
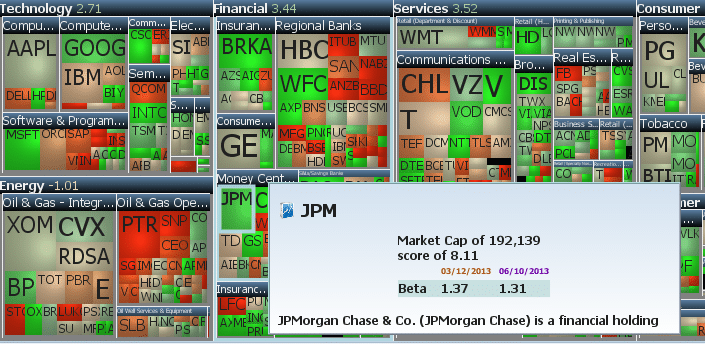
In a Stock Screener, drag the property Beta into Show in results, then hover over stock. Notice how it displays the property’s value.
Once you move a property to “Show in Results,” it will be available for use in the heat map for sorting and sizing, in the results table, in the scatter chart for use as the x or y-axis, and in the bar chart for use on the x-axis.
Now move the Property to Hide in results and notice how we no longer display the value when you hover over a stock.