Monte Carlo Simulation – Advanced Investing
Monte Carlo Simulation
We frequently are unsure what the best parameters for a screen are. We could run the same screen over and over again, varying one parameter. But what’s the fun in that. Enter the monte_carlo operator. This operator lets you have a screen that runs over and over again, varying the parameter (or parameters) in question, so you can see the range of results.
What does this mean?
First, we build a model we want to test. In the case below, that model would be the Screener of which we want to plug in different values for the Value Score.
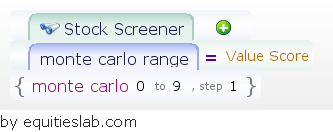
In constructing a simulation, we look for the “Monte Carlo Range” operator within Equities Lab and set it equal to, less than, or greater than the item we want to run through the model. For simplicities sake, we are going to use the Value Score which caps out at nine different variations. Wanting to include each of these variations we set the range from 0 to 9 and every backtest will step up by one to cover all possibilities. This sort of simulation isn’t limited to simple screens like the one above.
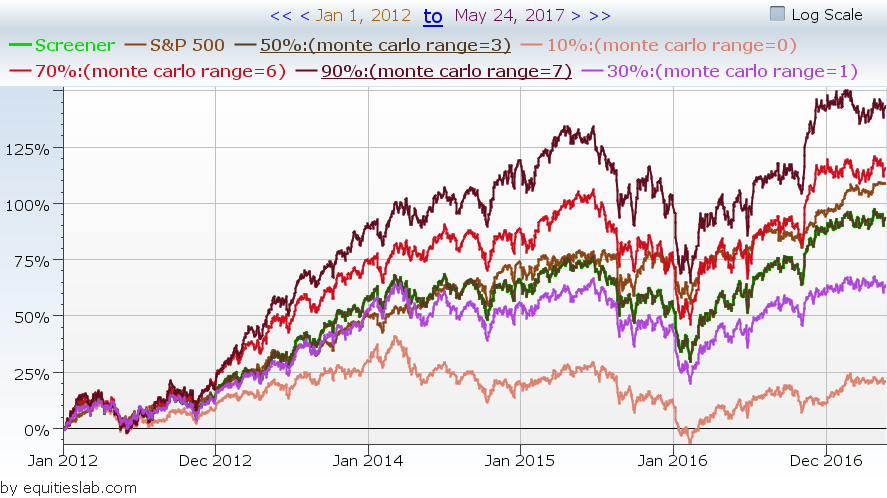
Let’s go ahead and run the simulation and see if it yields any useful results.
At first glance, it appears that, for the past five years, investing in companies with a value score of 7 yielded you the greatest overall return. However, as investors, we need to be able to dig deeper and look at the risk associated with investing in companies at each level.
This simulation of 10 different backtests(not every backtest plots on the graph, but we will go into that in a later article) took a total of 3-minutes to run. If we wanted to run each of these backtests for verification purposes manually, we can. It would just require us to take a chunk of time out of the day to run a test, analyze results, plug those results into excel to be analyzed further, and do that same thing all over again another nine times. At first, this may not seem too bad, but once you start having to do 50 iterations of this, you start realizing the value of using a simulation.
We can then head over to the backtest report where we can compare the results of the average within the overall distribution to each of the other parts of the simulation.
How’d the 50th percentile do?
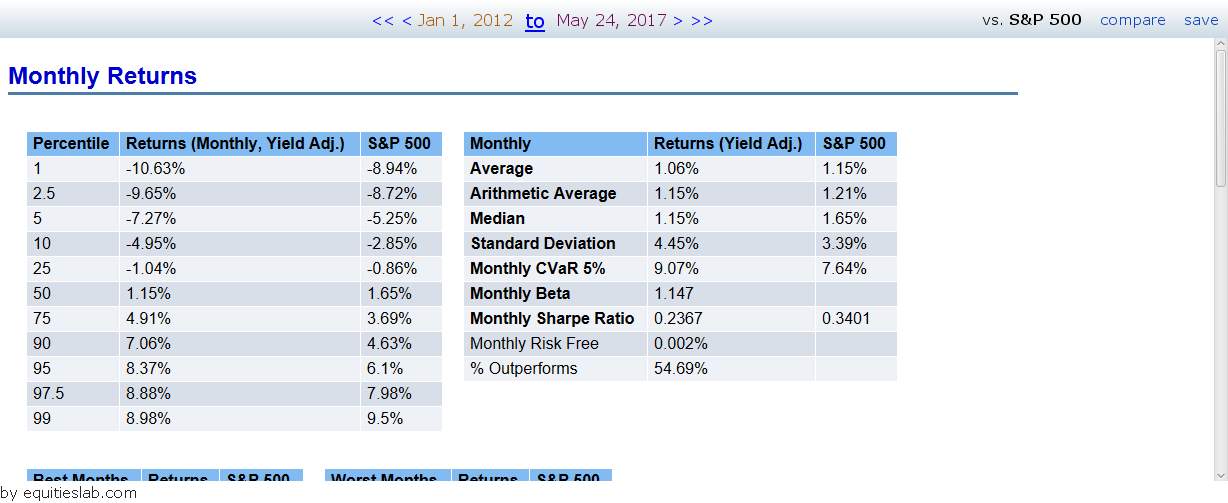
The 50th percentile, or Value Score = 3, averaged a return of 1.15% on a monthly basis with a standard deviation of 4.45%. At the end of the day, we can take a look at my preferred Sharpe Ratio, to assess risk/reward. In this case, it gives us a total of 0.2367. This score is a little worrying as it appears that you would have been able to return more by investing in an S&P index fund at a lower standard deviation – resulting in a Sharpe ratio of 0.3401.
What about the 90th percentile?
The highest performing Value Score in this simulation came in the form of Value Sore =7. So, the best performing Value Score group was comprised of companies who had all but two of the value factors looked for by the score.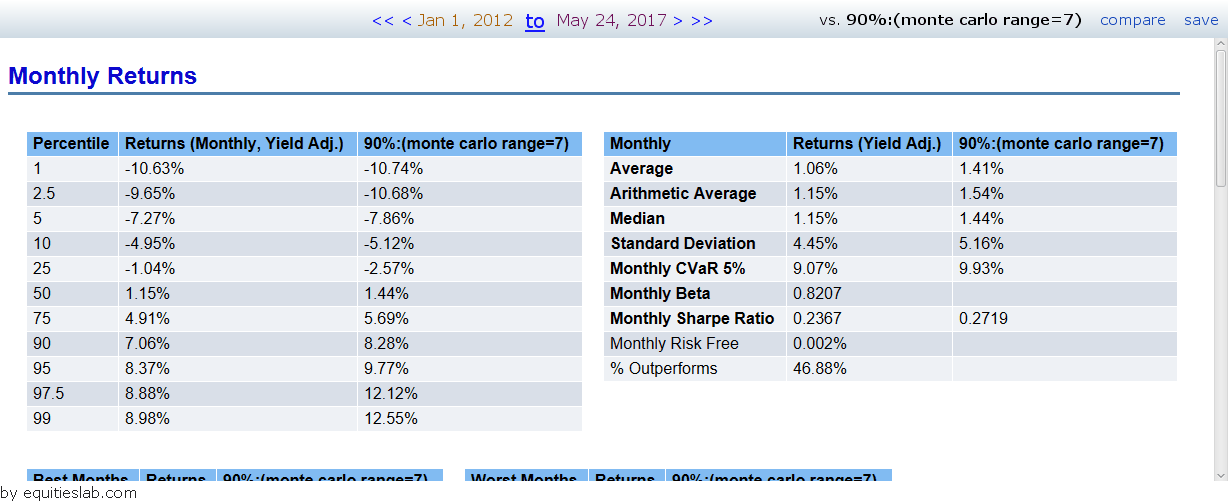
My first impressions of the report are that you do get a jump in returns by about 0.4% monthly, but you also get an almost 1% hike in the standard deviation – making this a riskier investment than buying the average 50%. At the same time, it appears that this increased risk pays off as the companies in the top 90% sport a Sharpe of 0.2719, a 0.04 increase from the middle 50%.
All of that said, it does appear that the companies that fall into the 90th percentile still do not beat the S&P from a risk/reward standpoint. In the end, investing is always about which risks you want to take for X amount of reward. If you are a value investor, you may be inclined to take that extra risk to make a few extra points at the end of the year. These simulations can never really tell you what to do as an investor, rather, they act as tools to offer you all of the information you need to make an informed and rational decision when it comes to investing.
Is this the only way to use Monte? Not at all! In our simple example of the Value Score, we are pretty much just backtesting and analyzing the different deciles. Though that has value in our decision-making process, we should be able to take it a step further. In that interest, let’s take a Monte Carlo Range for PE.
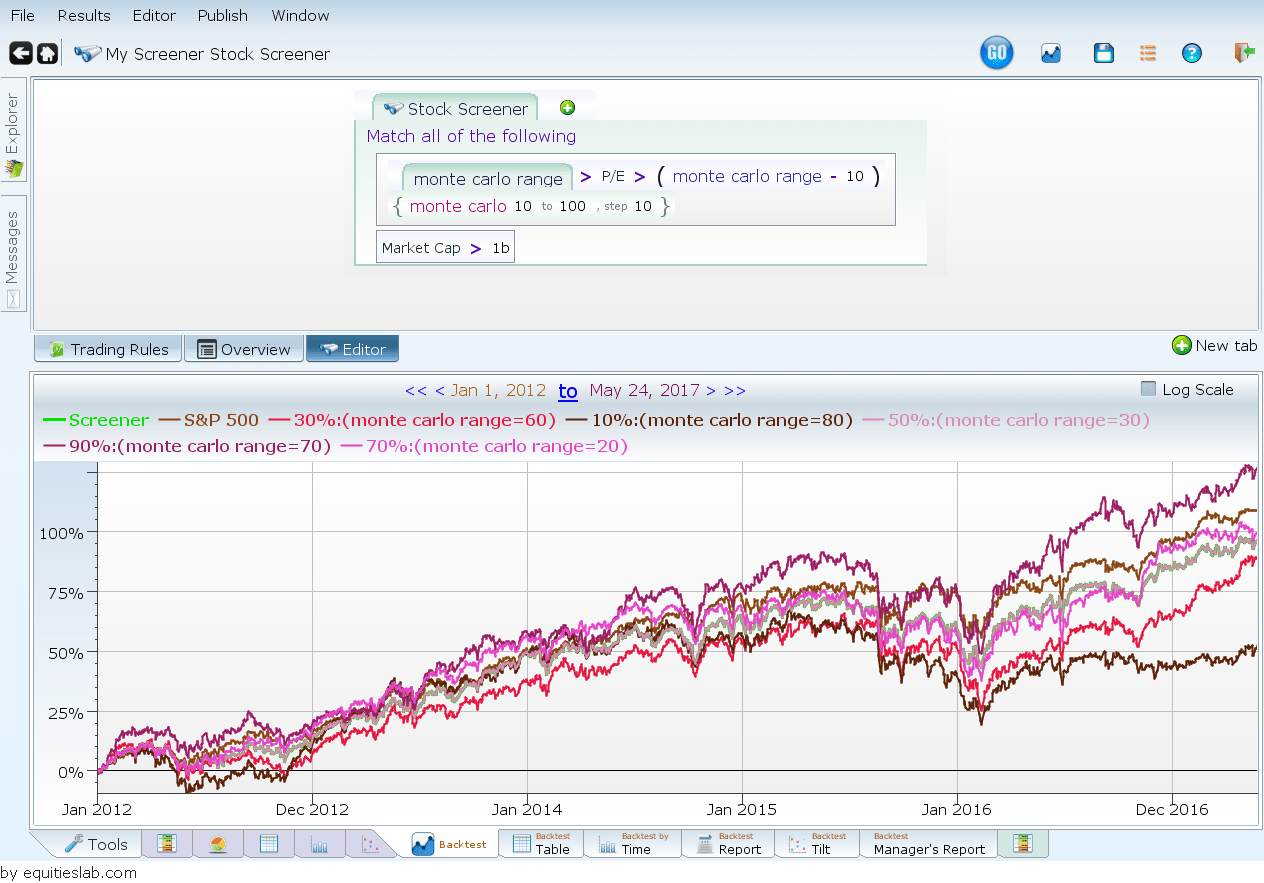
In this scenario, we create isolated bubbles that we want to test. We run a backtest for all PE’s between 0 and 10, and compare that to 10 and 20, 20 and 30, etc. all of the ways until we finish up at 90 to 100. These backtests are then plotted, and information based on the best and worst performing ranges is presented in line with a natural distribution curve. You can add any number of parameters to your screen and get the most applicable data for whatever you are trying to do.
The Catch
The Monte Carlo simulation is incredibly helpful – particularly for people who need to run multiple simulations at once to find their perfect investment. However, it isn’t a feature that is available to everyone. Running such a simulation is incredibly taxing on our servers, and because of this we are currently only allowing users with Institutional level access to use this feature. And though it’s called “institutional” we don’t require you to be a part of an investment institution. It’s simply a slightly more expensive level that unlocks many sophisticated features that can and will help speed up the time it takes to find, and pull the trigger on, new investments.