
Piotroski F-Score FAQ
What is the Piotroski score?
The Piotroski F-score consists of nine different factors in order to test the financial stability of a company. Created by Joseph Piotroski, and released in his paper Value Investing: The Use of Historical Financial Statement Information to Separate Winners from Losers, it is used to identify companies that are at risk of bankruptcy. On the flip side, if you use the f score to identify companies with a low chance of bankruptcy, you can actually build a screener with pretty good performance.
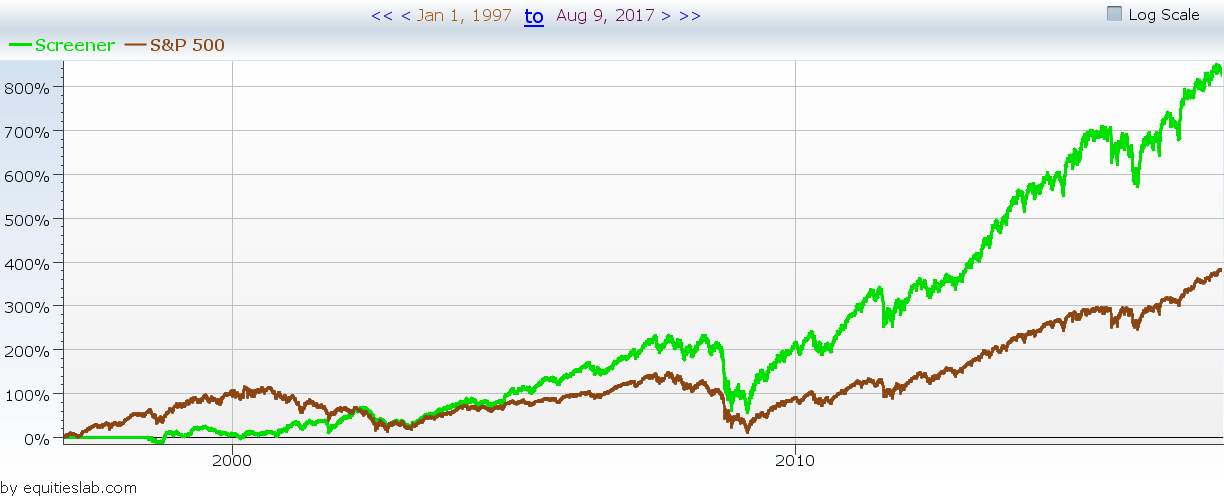
Does it outperform the market?
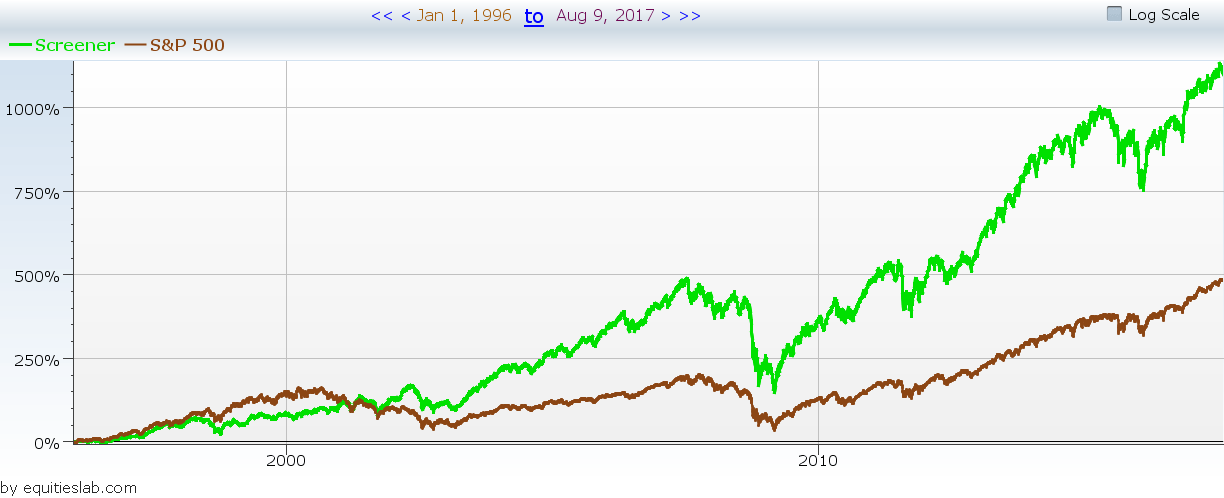
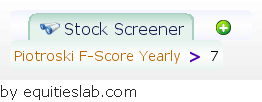
When screening for companies with a high Piotroski F score – specifically scores greater than 7, and backtesting those companies over the past 20 years, we can see that the companies with a high Piotroski score drastically outperformed the market netting 11% annually over the time frame. This isn’t without risk. This Piotroski Score screen is about 2% more volatile than the market on a monthly basis, but it has historically made up for that added volatility with added returns.
How do you calculate the Piotroski F-score?
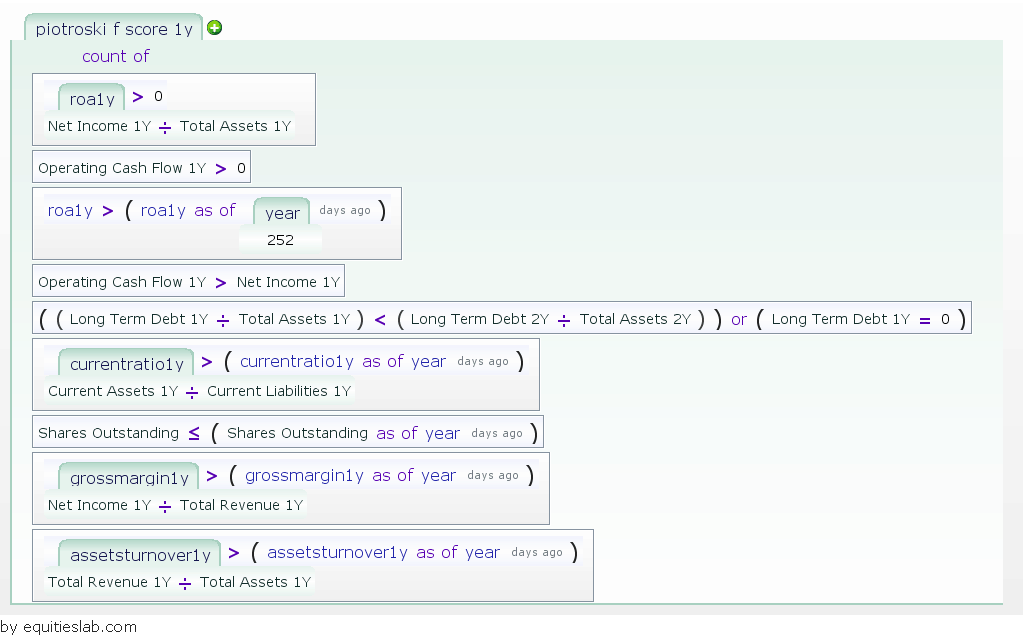
To calculate the score, simply check how many of the following nine conditions are true. We’ve grouped them into three categories for clarity, but each rule is worth one point, regardless of which category it is in.
- Profitability – Contains the first four items of the f score
- Return on Assets must be above 0
- Operating Cash Flow must be above 0
- This year’s Return on Assets must be higher than last year
- Operating Cash Flow/Total Assets must be higher than the Return on Assets
- Leverage – Contains the next three terms of the Piotroski Score
- Long-term leverage must be lower than it was the previous year
- The Current Ratio must be lower than it was the previous year
- Total Shares Outstanding must be equal to or less than it was the previous year
- Operating Efficiency – Contains the final two items of the Piotroski F-score
- Gross Margin must be higher than it was a year ago
- Asset Turnover ratio must be higher than it was a year ago
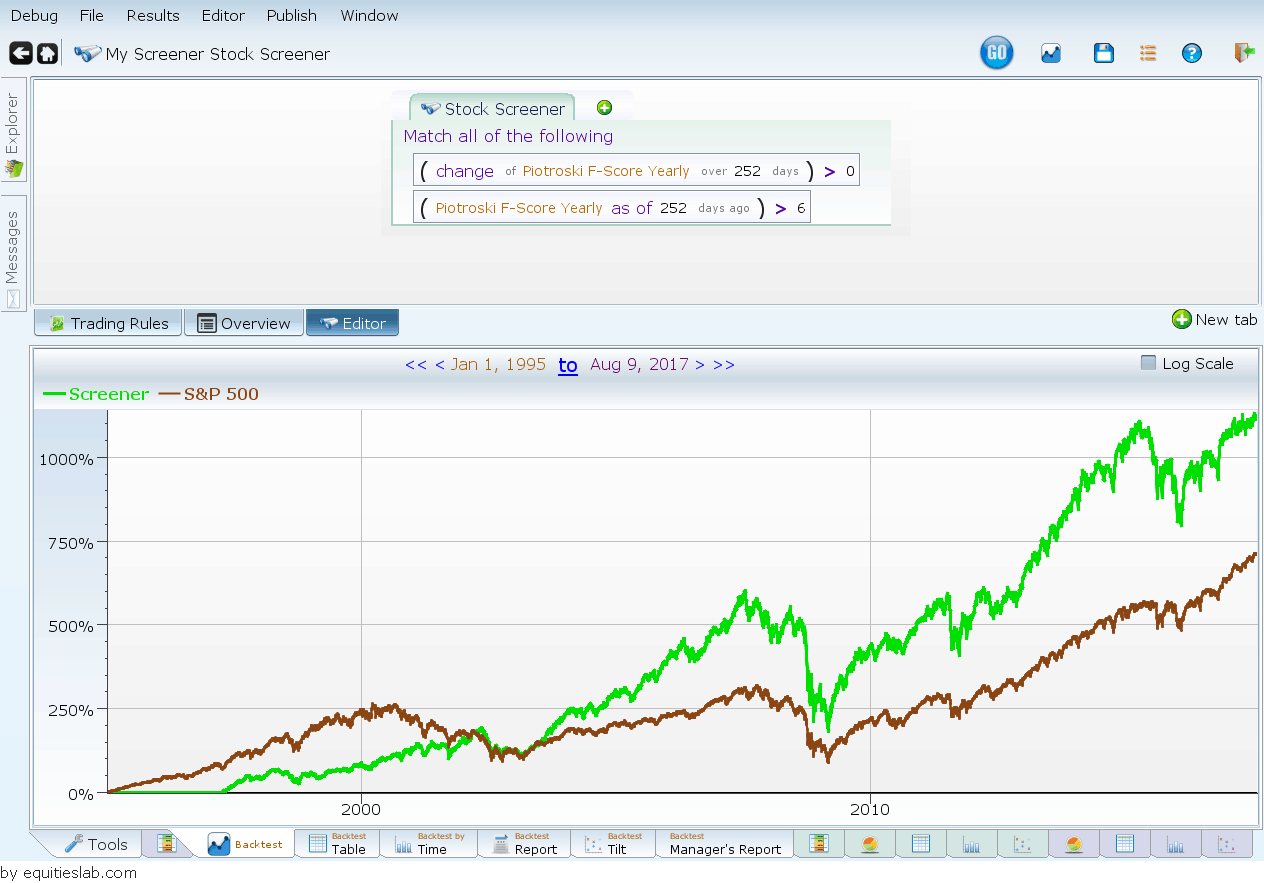
How do Screen for High F-Score stocks?
Depending on your choice of screening software, screening for the Piotroski score can be as easy as typing in a few characters, or as hard as building the entire thing from scratch. There are a number of companies out there that offer screening services for the f score. In the case of Equities Lab, you only need to type in a couple of small things and you’ll have a fully customizable screen that you can build to whatever specs you’d like. You can actually even go in and edit the Piotroski score to make it fit whatever your goals are. If you aren’t into the idea of building your own screen, there are also a number of prebuilt screens that fit right into your portfolio.
Can the Piotroski Score Improve your Investment Strategy?
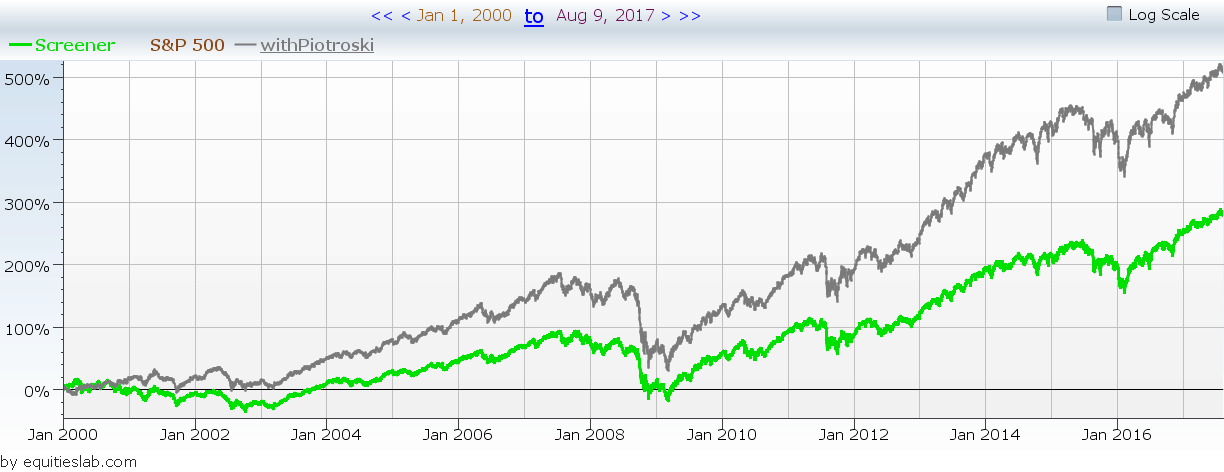
Though it is unlikely that the score will improve every investment strategy you have, it may very well be able to improve on a couple of them. In the image I took a standard strategy – High market cap, good earnings, etc. – and backtested it (green line). I then took that exact same strategy and input a Piotroski score > 7. This strategy was then backtested over the past 17 years next to the original screener – giving us the gray line. So I would say it does improve some strategies significantly. On the flip side it could have a negative affect on certain strategies. I tested attempting to add a high piotroski parameter to a small cap screener and the performance was significantly worse than without it.
Can the Piotroski Score help value investing
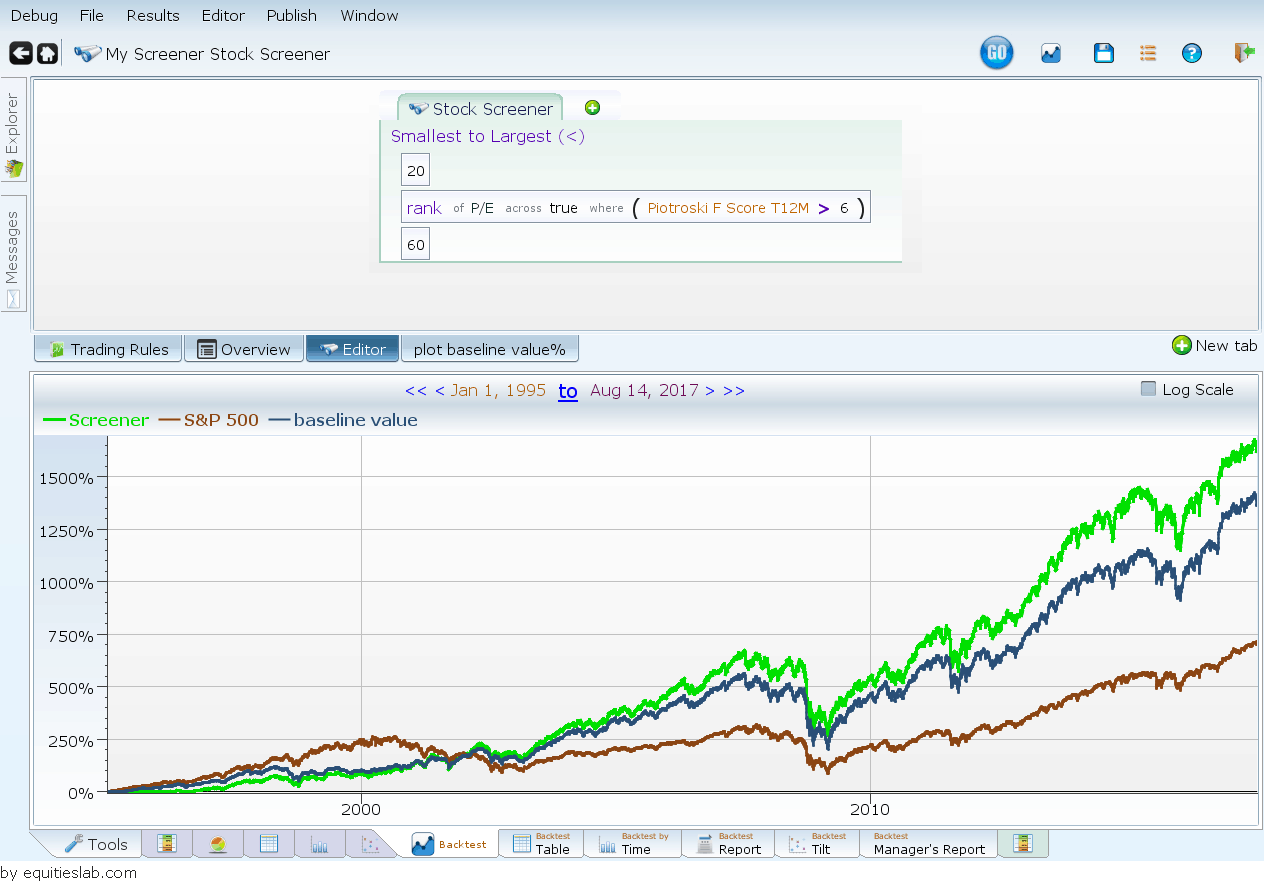
Yes! Joseph Piotroski wanted to enhance his value investing strategies by figuring out how to screen out bad investments. This led him to run a linear regression, and create the Piotroski score. Though there isn’t a large difference using a Piotroski F-Score of greater than 6 has helped to enhance returns over the past 20 years for companies who’s P/E is ranked in the 20th to 60th percentile of all companies.

Who is Joseph Piotroski
The creator of the Piotroski score, Joseph Piotroski started his academic career at the University of Chicago in 1999, only one year before publishing his famous paper outlining the score that shares his namesake. Now serving as a Professor of Accounting at Stanford University, he has been featured in many Accounting journals, and written many of his own papers on his research into the world of Value Investing.
Does the Piotroski Score Accurately Predict Bankruptcy?
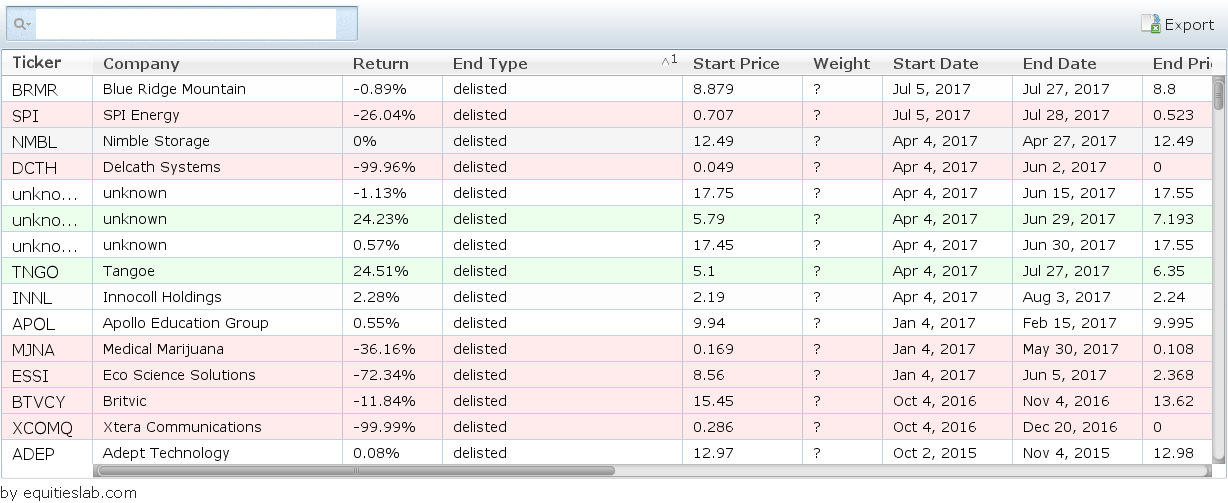
The Piotroski Score was developed to offer a multifaceted outlook on the world of investing. If you switch the F Score around to only screen for companies that have a score of less than 3, you are given companies that have a higher likelihood of going bankrupt. I went ahead and backtested that screen just to see how many companies were delisted from the market or thrown out of the investible universe over the past twenty years. Now, I know that delists or falling out of the Universe doesn’t necessarily mean bankruptcy, and I originally intended to go into each company that was delisted and see if they had in fact gone bankrupt. However, there were too many companies to make that a feasible task. Out of 30,000 trades made over the past twenty yeas – almost half of them were delisted or fell out of the universe.
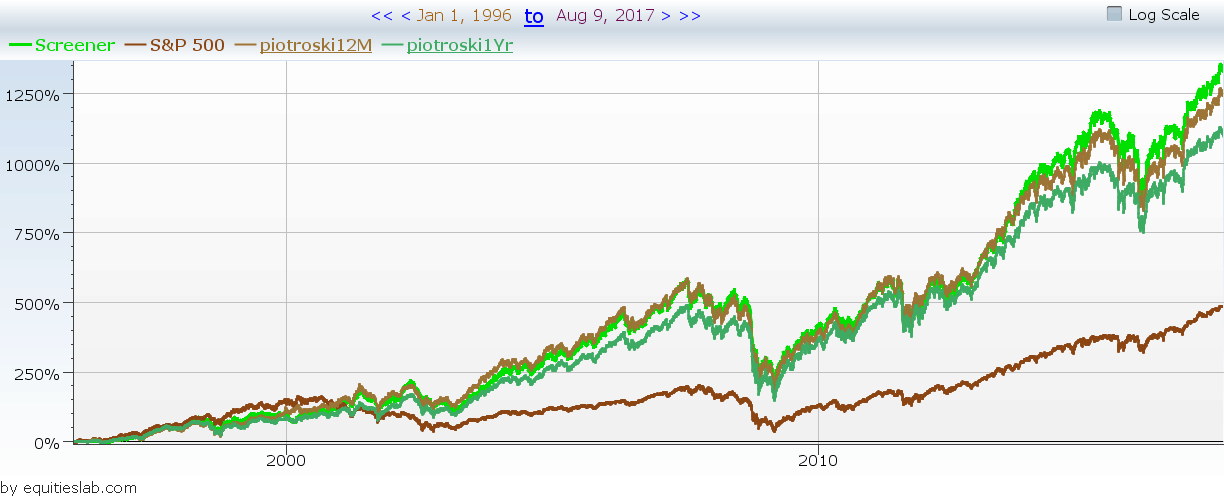
What’s the difference between Piotroski T12M & Piotroski 1YR?
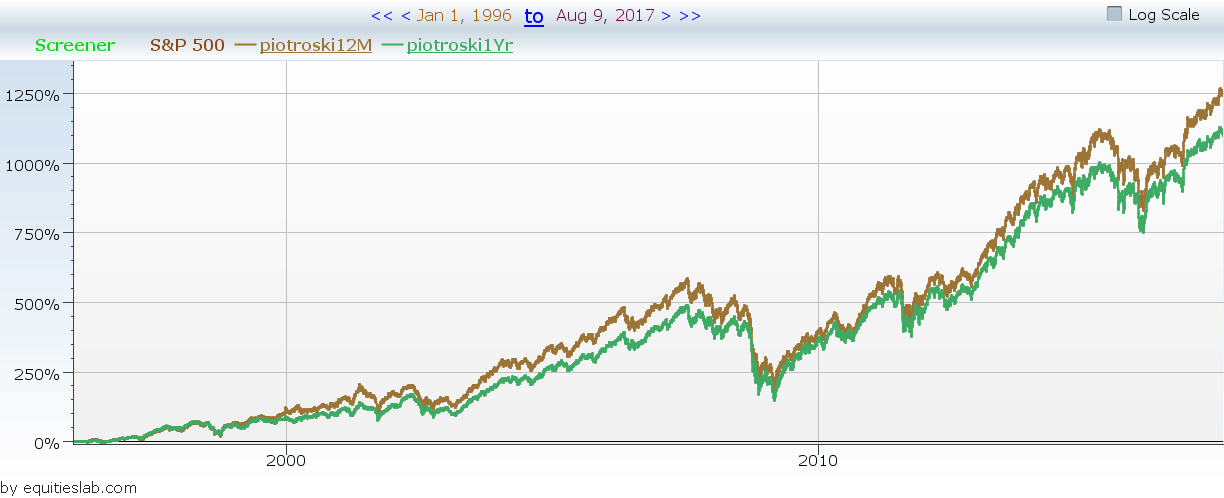
The Piotroski T12M takes the most recent four quarters of financials and builds the Piotroski score trailing twelve months out of those. The yearly Piotroski score on the other hand, takes a look at the most recent yearly financials and constructs the Piotroski Score off of those. General logic would say that the Piotroski T12M is two quarters ahead of the yearly score, and therefore more accurate. This extra bit of accuracy translates into slightly better performance over the yearly score.
Can you use them together?
Though the difference in performance isn’t great, a screener that searches for companies with a high Piotroski f score on both the 1 year and Trailing 12 months, does perform slightly better than the backtests of the each of them individually. Better yet, the risk appears to be fairly stable between the three strategies – allowing the combined screener to pick up a Sharpe Ratio of 0.1918 whereas the other screens only returned a ratio of 0.17 each.
How do Companies with an Average High Piotroski F-Score perform?
Looking for companies with an average Piotroski Score > 7 over the past three years does still out pace the S&P 500, but underperforms simply looking for companies with a current score of greater than 7.
How is the Performance of Companies with a Growing Piotroski Score?
The results for companies with a growing F-score aren’t much different than simply screening for companies with a high score from the outset. This is simply because, in order to make the best performing screeen, we needed to only look for high piotroski companies from day one. The score is highly accurate in finding companies that are going to underperform or even go bankrupt, so screening for companies with poor scores in day one will almost never result in a better return.

What are other Investment Scores?
Lots of very smart people have studied the stock market. These people are smarter than you or I, and they have spent countless hours poring over the data to create interesting formulas and insights. Formulas and insights which we have encoded in Equities Lab, in an open, transparent way:
- Piotroski Score
- Altman Z Score
- Ohlson’s O Score
- Montier C Score
- Declining Wedge
- Ascending Triangle
- Quality Minus Junk
- Book Value
- Stock Idiosyncratic Risk
- Leverage Ratio
- Weighted Average Cost of Capital
- Interest Coverage Ratio