
What does a stock hitting its 52 weak high mean?

The 52 week high
A stock hits a 52 week high when its high price for the day, known as its high, is also the high for the year. Lots of digital ink has been spilled, highlighting this occurance as a omen of doom or an sign of good times to follow.
Testing it out
I, however, have the ability to simply test it out, and see what the result is. We backtest it, by holding a series of simulated portfolios, rebalancing each quarter, to see what the long term results of following a strategy holding these stocks would be. Imaging an ETF “52WK” (yes, I know tickers can’t start with numbers in the US. This is not a real ticker.
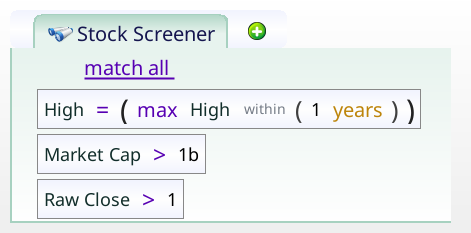
The market cap filter is there to get rid of tiny stocks, as big moves on tiny stocks are not actually a big deal. You would expect that with these filters, you would get nice smooth lines. You would be wrong, as this strategy picks up short squeezes. With a short squeeze, the stock market genuinely goes bananas, pushing up the stock price more and more, to force out short sellers. As they get forced out, they buy, pushing out more short sellers. When the short sellers are all gone, the stock crashes back to Earth almost instantly.
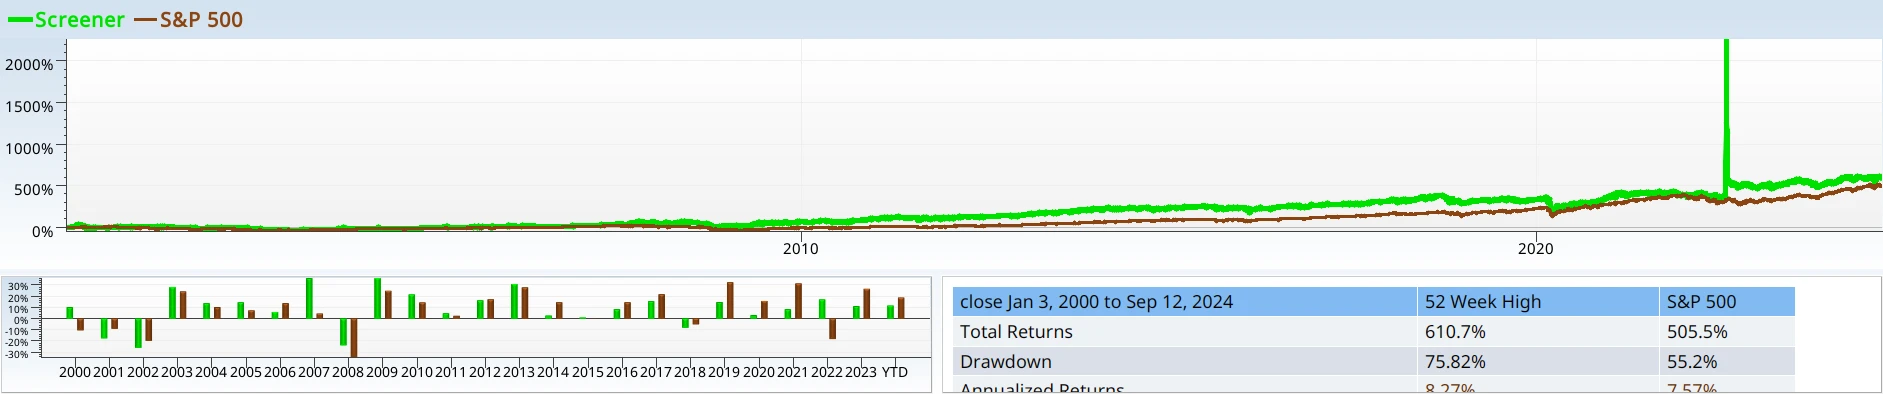
Quarterly rebalance
Dull, boring results (substandard, not terrible performance, and high volatility):
OK, maybe we are holding it too long. Perhaps this is an indicator that favors those who are fleet of foot (or at least willing to trade more than 4 times a year!).
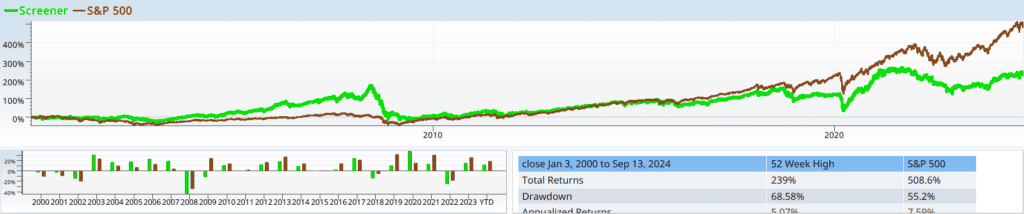
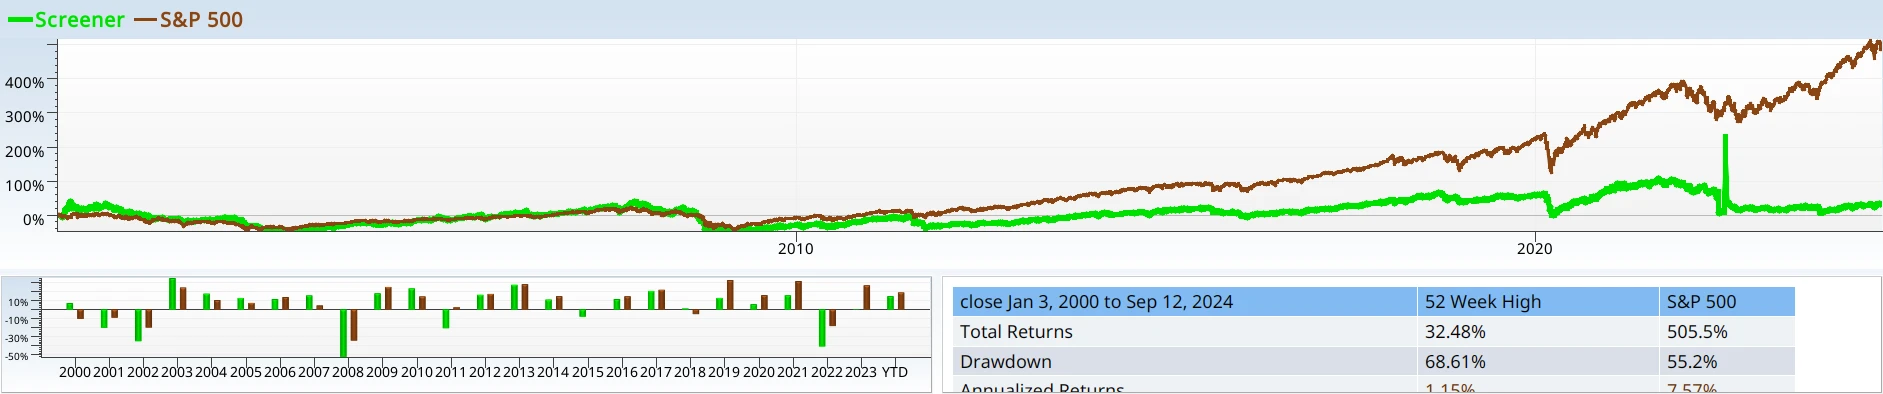
Monthly rebalance
Trying monthly on each week, I get the following:
Monthly week 1. Notice the recent performance is even worse.
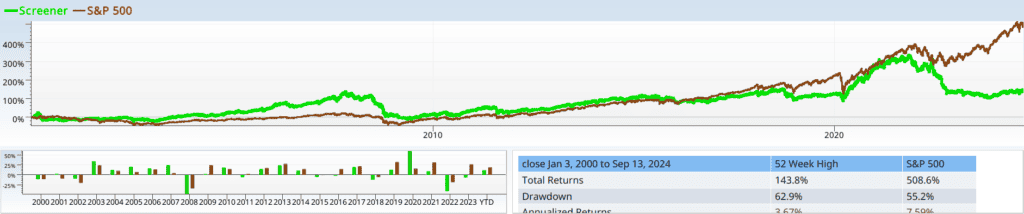
Better performance, but still the same terrible drawdown.
Monthly week 3. The drawdown is even worse, though that is due to the AMTD Digital corporation (ticker HKD), which in 2022 had a massive short squeeze, going up, and mostly, back down over the period of one week.
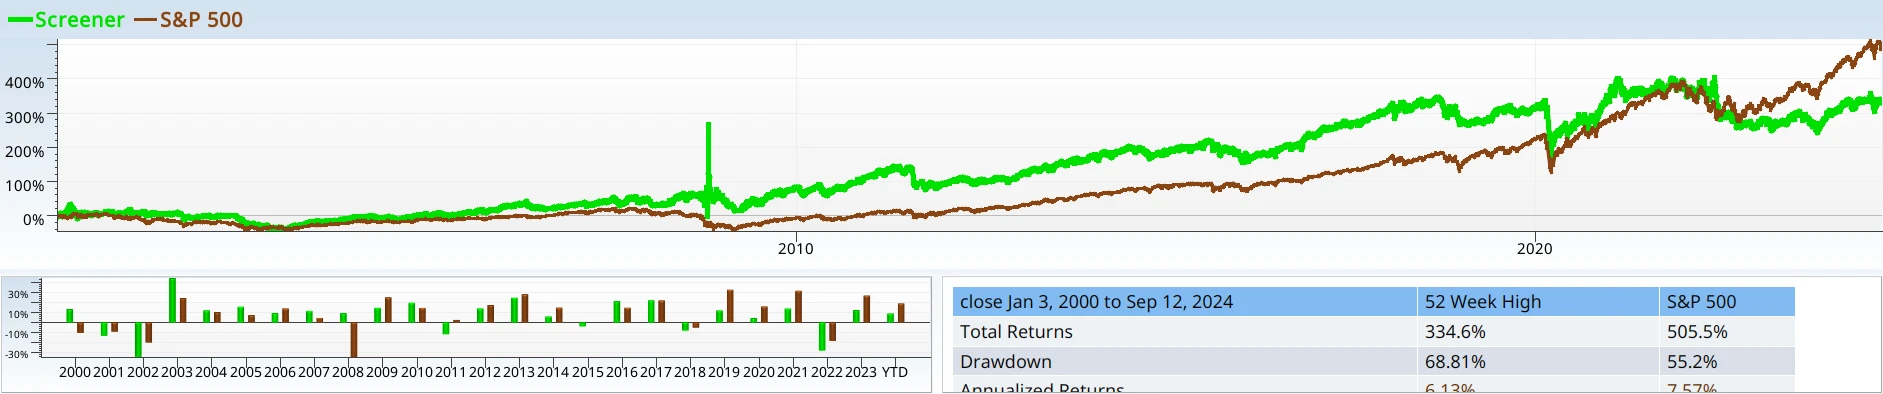
Same story, offset by one week.
None of this excites me. From all this, I’d say 52 week highs are not a predictor of anything except excess volatility.