
Investment Green Flag – Positive Operating Cash Flow over the Past Year
We’ve all heard the old trope that Cash is King, but is it true? Well, in terms of a company, it just might be. As part of our Green Flag score, we created a screener requiring a positive operating cash flow over four quarters.
Keep reading to discover how to evaluate operation cash flow, the results, and the takeaways.
The Formula
If you are unfamiliar with operating cash flow, it is precisely what the name suggests – cash flow from operations.
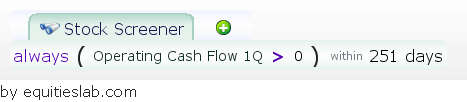
Below you can visualize what was input into Equities Lab software. Although the parenthesis emphasizes only 1 quarter, the specification of 251 days means it will include all 4 quarters.
The Results
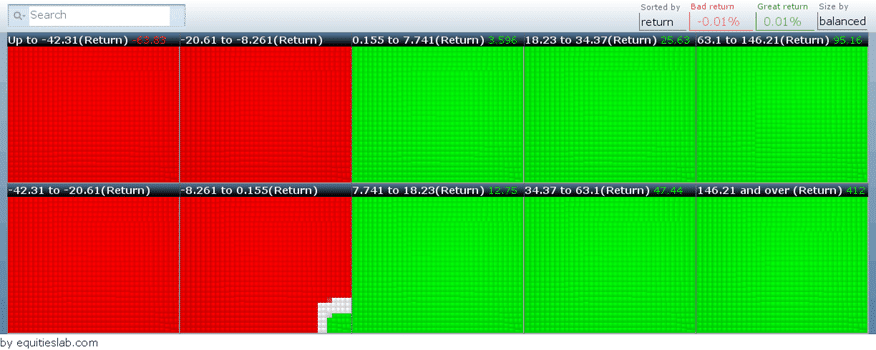
Each of our Green Flags must conform to a few rules to ensure they are green flags in investors’ eyes. One such requirement is that a flag must have a win ratio of at least 50%. As you can see by the image below, this strategy has a win rate of just over 60% regarding this specific flag. Not too bad.
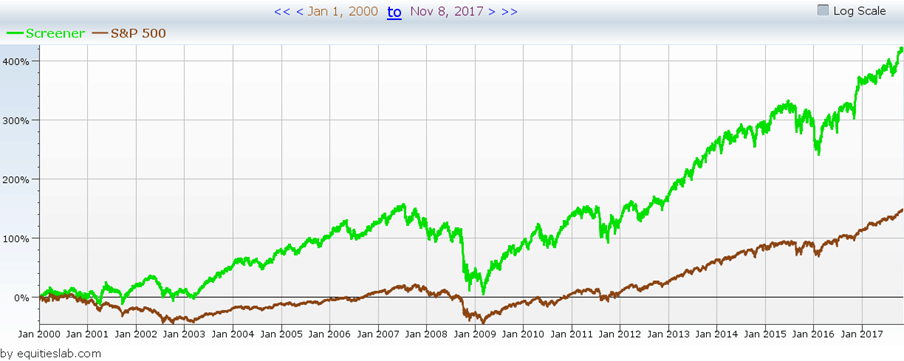
We also want to ensure that the strategy beats the benchmark over the designated time frame – 17 years in this example.
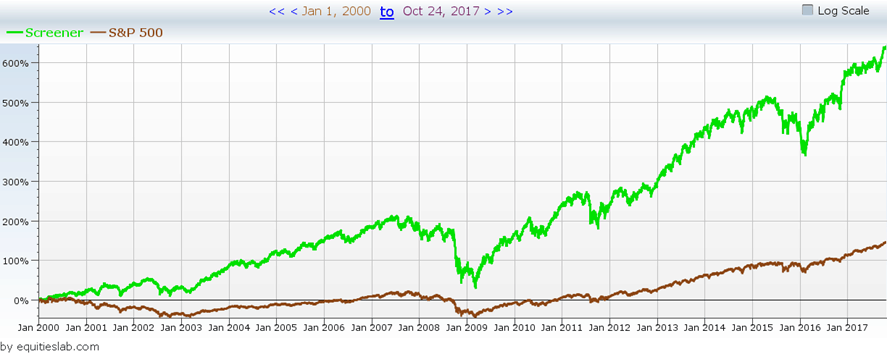
Over that time, the flag returned 11.89% annually. On the other hand, the benchmark S&P 500 returned a measly 5.18% annually over the same time frame.
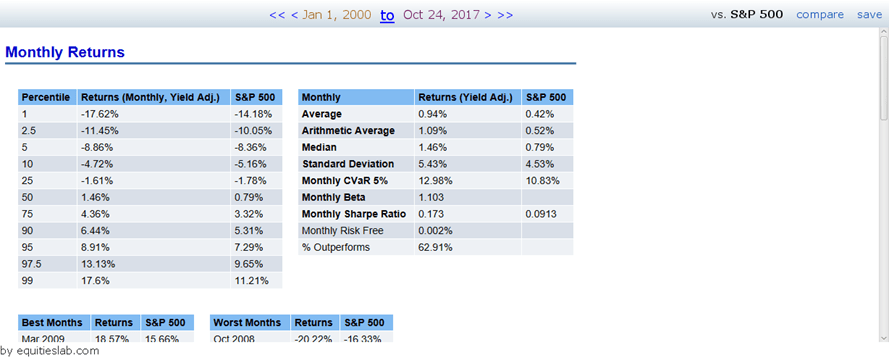
Diving a little further into what these returns actually mean – let’s look at if those returns were really worth the risk taken on. We can do this by comparing the Sharpe ratios of the benchmark and our flag and see that our flag has a much higher ratio than the S&P. This suggests that the slightly higher risk taken throughout the strategy was worth it compared to simply investing in the S&P 500.
Takeaways
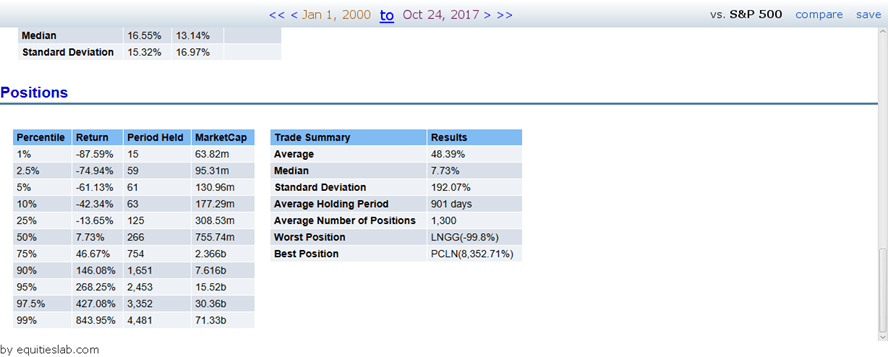
On average, companies with a positive Operating cash flow tend to continue to have positive operating cash flow for an extended period. We held positions for an average of 901 days, and our best position earned us over 8000%. This is not a strategy to invest in as it returns over 1000 companies, but it is a building block for a bigger strategy and an indicator that what you’re looking at investing in is a good buy.