
Protect and Maximize Profits with Stop Losses and Gains

Understanding Stop Losses: The Basics
Why use stop losses?
A stop loss, or a predefined order to sell a stock when it falls to a certain level, is a tool to help people limit their losses. The theory is that if a lower limit is reached, it is time to move onto a more profitable investment, or get out to limit losses. Stop losses are popular enough that they get written about a lot. Some Examples:
- Quant-investing.com has a nice article that outlines some approaches people have taken.
- www.fractalerts.com says that stop losses are not useful, because people push the stock price down to “hunt” the stop, hit the stop, watch you sell, and then buy the stock at that lower price.
- www.quantifiedstrategies.com also does not like stop losses, saying they hurt performance. They are more focused on tighter stops, and smaller time periods, so their advice may not apply.
- https://traderfeed.blogspot.com/2014/09/the-psychology-of-stop-loss-levels.html talks about the psychology of stops. I’ll be touching on some of the same issues he does, but with more data, and less elegant prose.
The takeaway from these references is that people want stop losses to decrease potential loss. They would want stop losses to do much better on declining stocks, and are not too unhappy if they reduce performance for stocks that are going up.
How Stop Loss Orders Work
A stop loss is a fairly simple idea:
Decide on a level, below which you will sell the stock
Observe the stock is below the level, and sell
Wait for a cooldown to expire, then buy again if desired
Types of Stop Loss Orders
There are only three types of stop losses people talk about. There are all sorts of variations of where to put the stop losses, but only three types of actual stop losses you can use.
Fixed Stop Losses
A fixed stop loss is when determined when you put in the buy order. It doesn’t change until you sell the stock. This is simple, and prevents you from being scared out of a stock by a scary market move. Typically people do this by leaving a limit order with the exchange, to sell the stock if it gets below the given limit.
Trailing Stop Losses
Trailing stop losses are different: they slide upwards as the stock does. This makes them a way to hang onto profits as well as a way to limit losses. They also get hit much more frequently, and can make you skip serious profits.
Mental Stop Losses
These aren’t really stop losses at all. They are actually a decision that you will abruptly sell your stock when some condition is met (the price is below X), but you have to remember to check, in to see if it actually happened. In essence, you are making the “observe” step manual. You may think you’ve automated the “decide” step, but it can be hard to pull the trigger — either due to failing memory or failing resolve.
As you can see from its simplicity, a stop loss system can be overlaid on top of any other trading system. So you can just try tweaking the level you decide on, how to wait for a new opening when you sell, and how you observe and sell.
Seeing it in action
The simplest system possible
I buy AAPL with a fixed stop loss of $120. I rebalance quarterly, which means that if I’m not holding AAPL, I buy. It doesn’t matter if I originally stopped out yesterday, or a quarter ago. I am buying using a metronome as a trading signal.
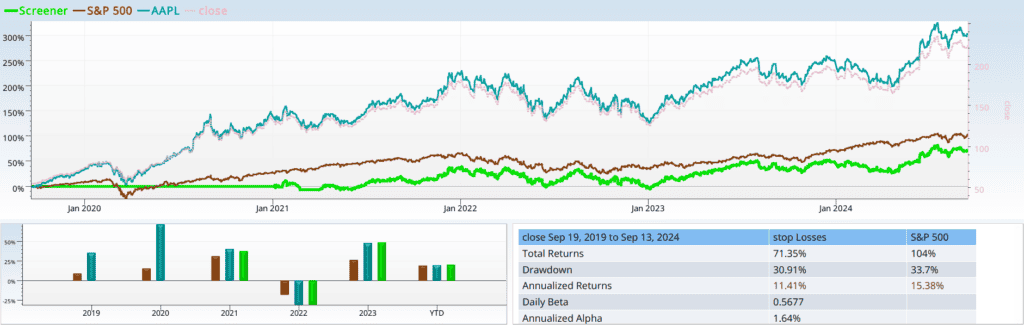
As you can see, this makes a huge difference in 2020, and a little difference in 2021, and no difference at all thereafter, because the price never gets down to $120 again. But where did this $120 come from anyway? I picked it out of a hat, to demonstrate how it works. A more normal thing to do is set a stop loss relative to the close when you bought it.
The simplest Typical system
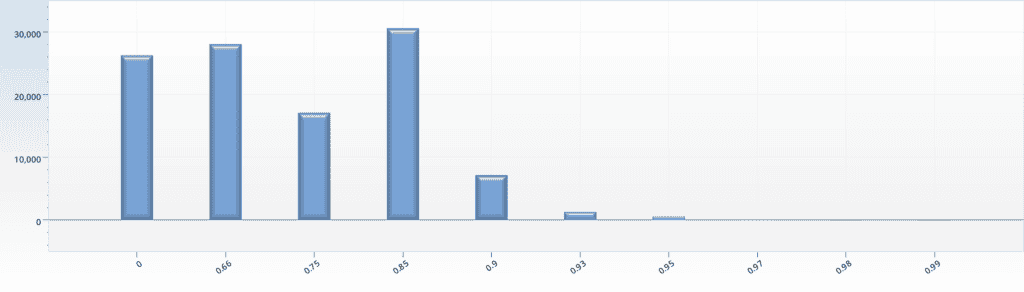
I keep the metronome as my buying signal. It’s really simple, but it does get us back in, and we are only testing against single stocks (for now AAPL). Things will get hairy soon enough. I now set the fixed stop to be close * k, where k is less than 1. In English, if k is .9, that means that if AAPL goes down 10% from where I bought it, I’m out. Until the next quarter. Before I test to see the right stop loss, I need a baseline:
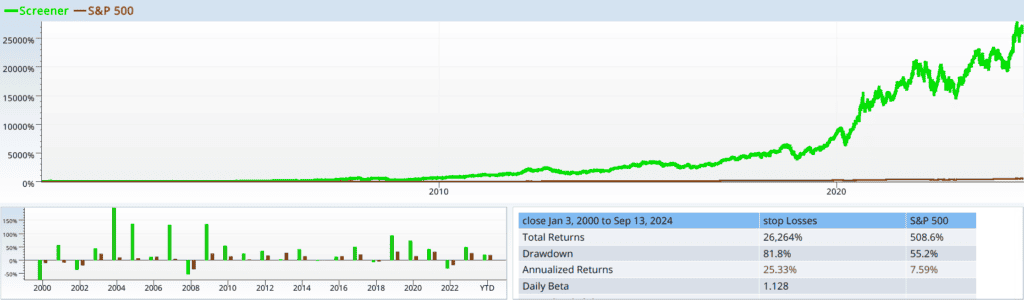
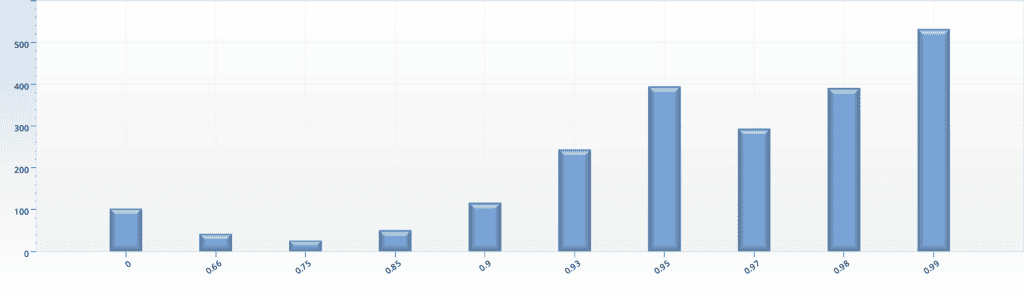
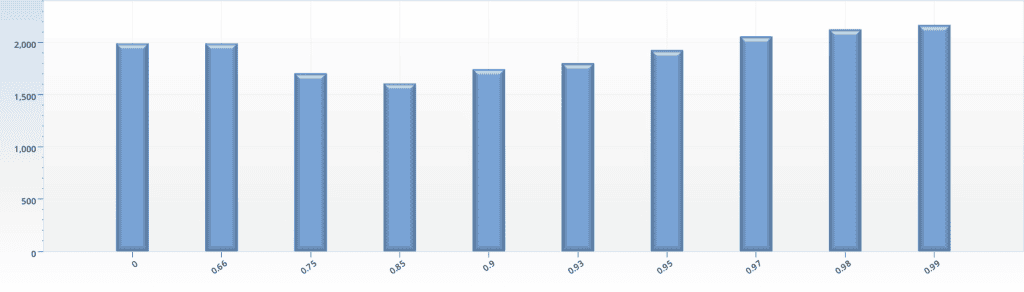
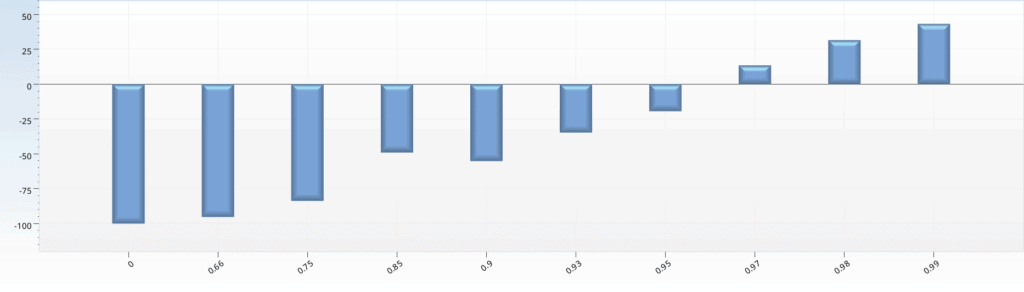
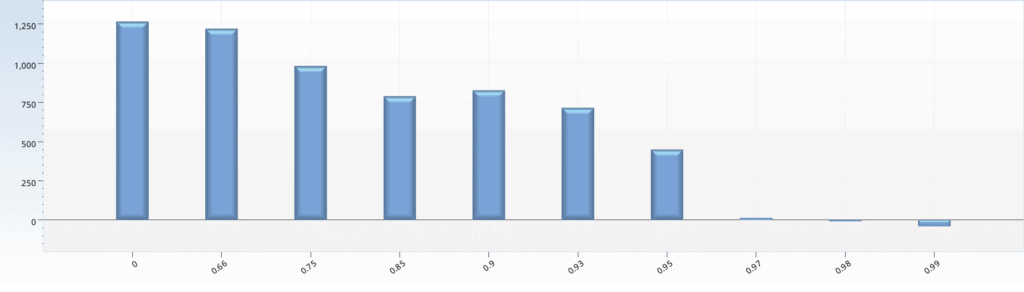
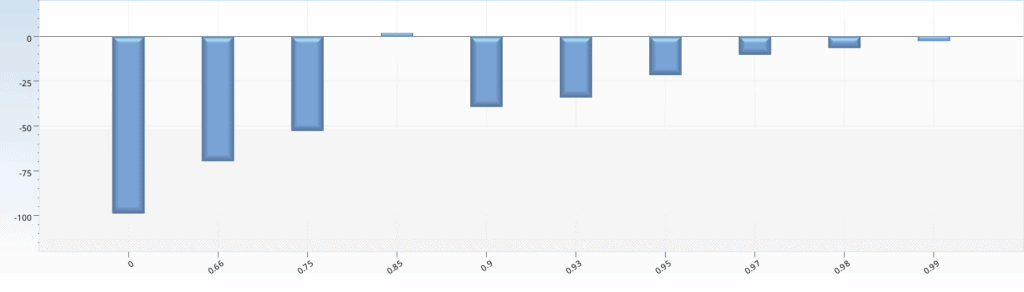
AAPL went up 26,264%. That’s just insane. I could have picked a more normal stock, but seemingly everybody owns AAPL, and it is a perfect test case for the stop loss vs the improbably good stock. Since these “home runs” drive most of the returns of most portfolios, handling them correctly is essential. Now I have what I need to find the correct stop loss level. Iterating from 20% stop loss down to 1% stop loss, I get this:
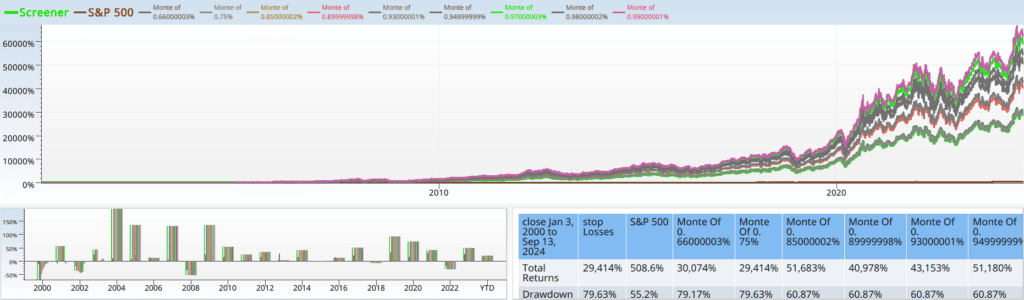
Wow. That is confusing. Luckily the bar chart will help us out. Looking down, I see that any stop loss is better than no stop loss, and tighter is better.
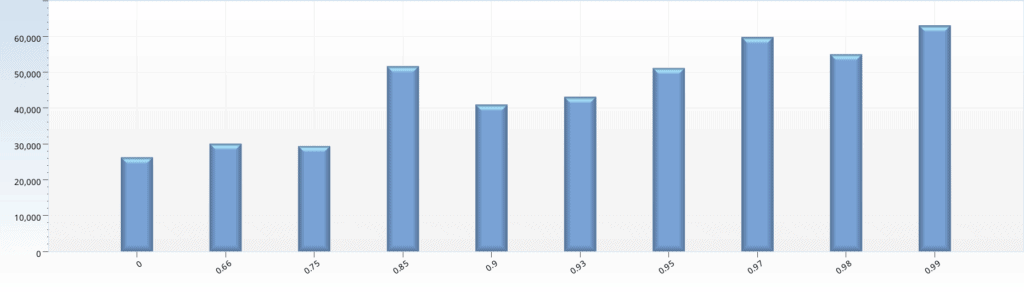
That seems counterintuitive, to say the least. Every bar beat the 0 bar, which is just buy and hold! Looking at the backtest by time, though, I can puzzle out what’s going on.
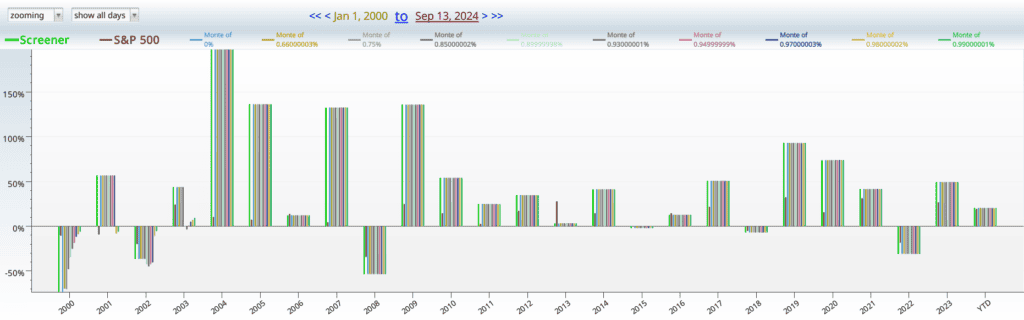
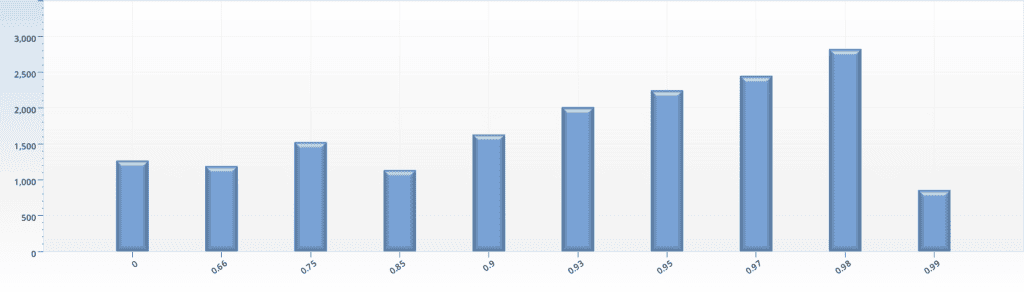
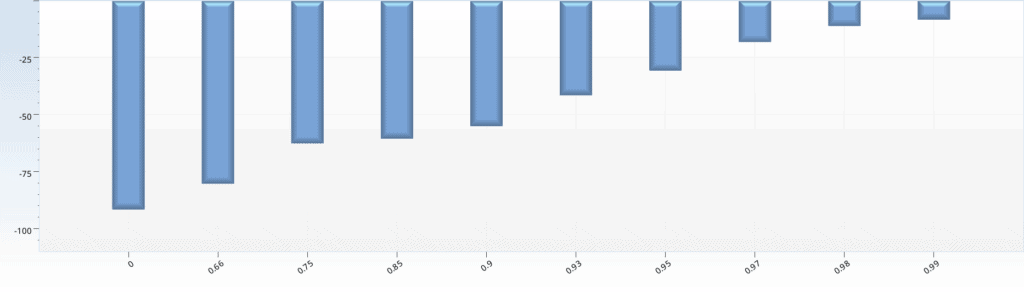
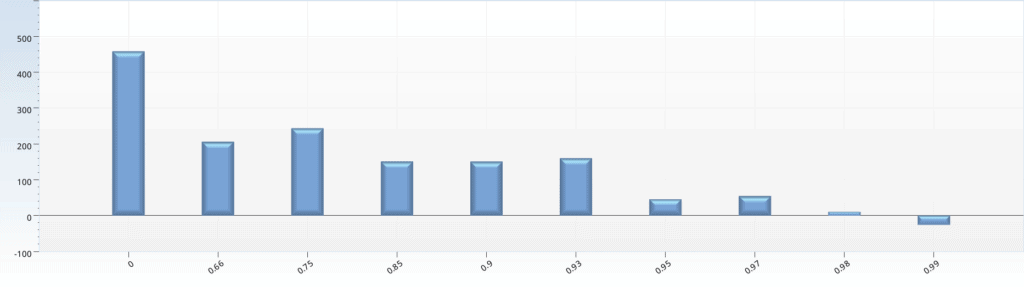
Look at the left hand side of the chart (the year 2000). Buy and hold of AAPL lost around 60%, and each one of the stop losses did better. This effect dwarfs 2003 and 2003, and it doesn’t matter for 2004 onwards, because AAPL never, never gets back down to where you bought it. For instance, if run the same test, but on GE, we can see similar results: tighter is better.
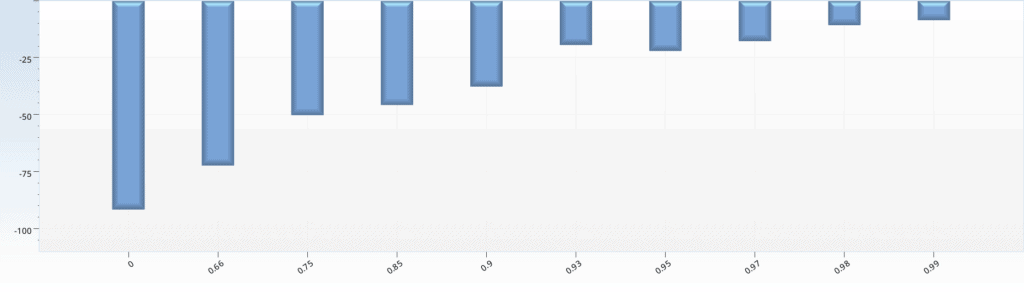
Now we try this with a small sample of stocks you may have heard of:
MCD
wmt
V
msft
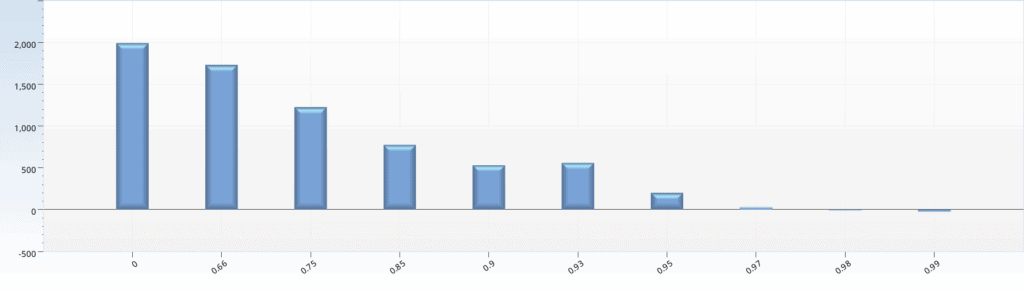
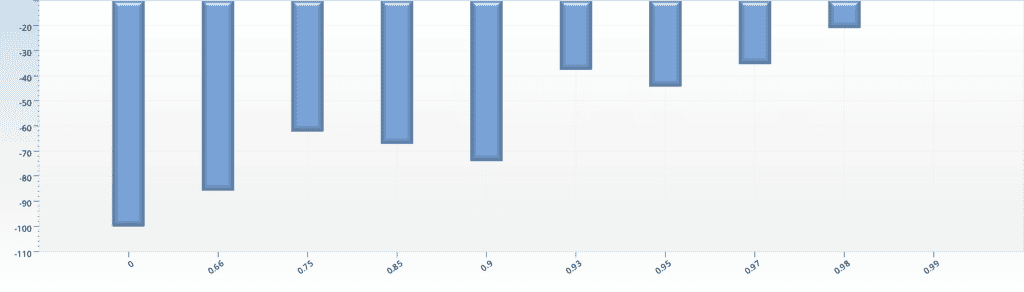
This is interesting, and implies stop losses on single stocks works well. But you owe it to yourself to try out some not so happy stocks. I pick four at random that are known to be delisted, so we can compare.
VLD (Velo3D)
BIGGQ (Big Lots)
DRYS (Dryships)
BNBN (Barnes and Noble)
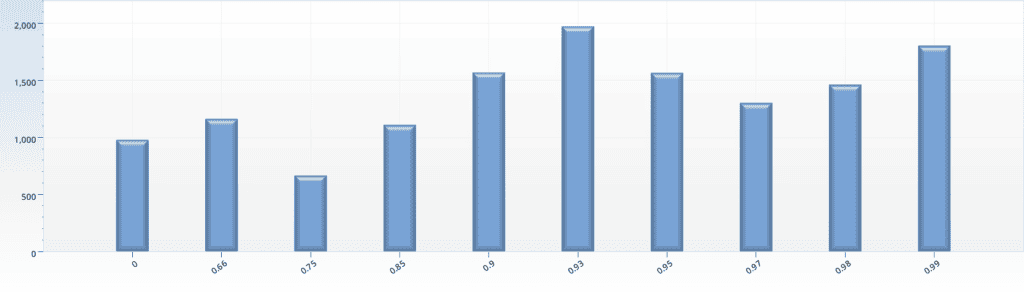
Clearly if you are investing in a single stock that is having a bad time, you could use a stop loss, and a metronome to get back in. The tighter the better. For stocks with a brighter future, the story seems similar, but less clear. Notice, though, that this is not a get out of jail free card. You still lost money, even with the tightest stops on most of the bad stocks. Why did you lose more than the few percent that the stop was set to? The problem is that you stopped out over and over again. It was better than just hanging on and losing everything, but it still was no fun.
Trying out Trailing Stops
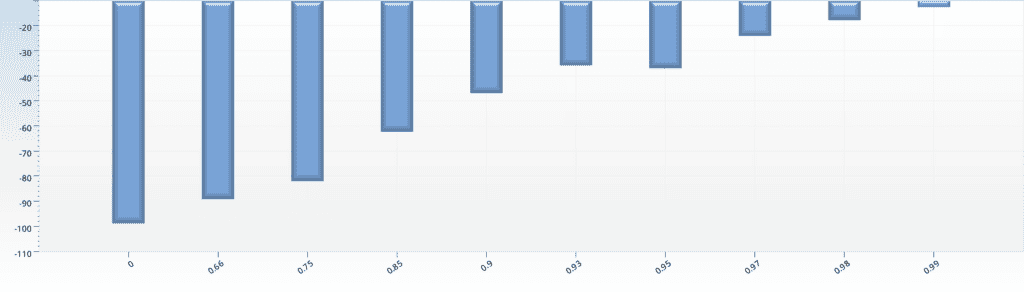
Now that we are good and excited about stop losses, I try out the trailing stop. Going back to AAPL, I try the same levels for stoppage, but I add a term “rebalance_stop_losses_up”, and set that to true. This is not a perfect simulation of the trailing stop (because intraday highs would push the stop higher at the brokerage, but don’t here), but it’s good enough to test out the theory.
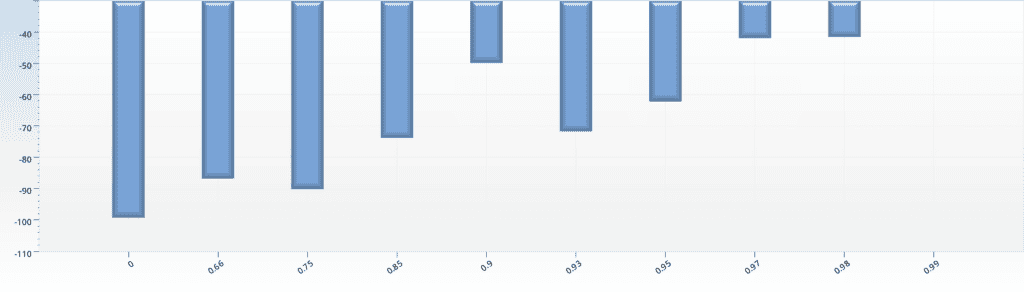
We do do a bit better with a 15% trailing stop than with buy and hold, but anything tighter than that and the returns just evaporate. Next up, we try out GE, and get that the 15% trailing stop wins.
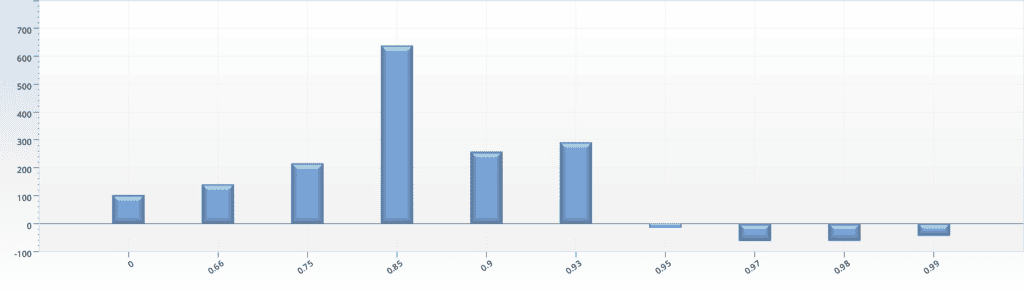
Here we see again that a 15% trailing stop beat everything else. It also beat the best fixed stop loss for GE. Encouraged, I now try the same stocks I did earlier, starting with the four household names:
MCD
wmt
V
msft
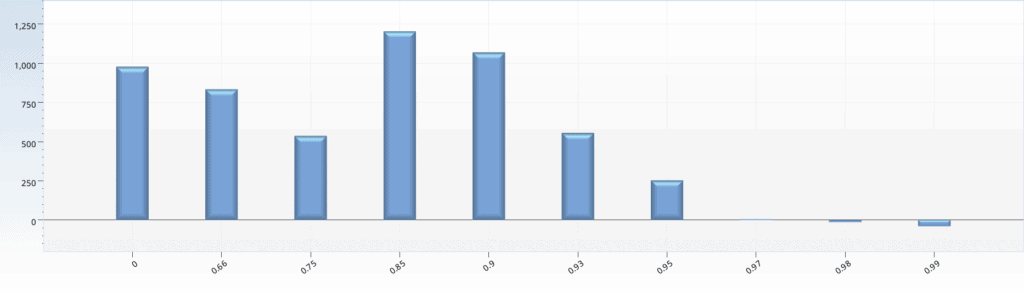
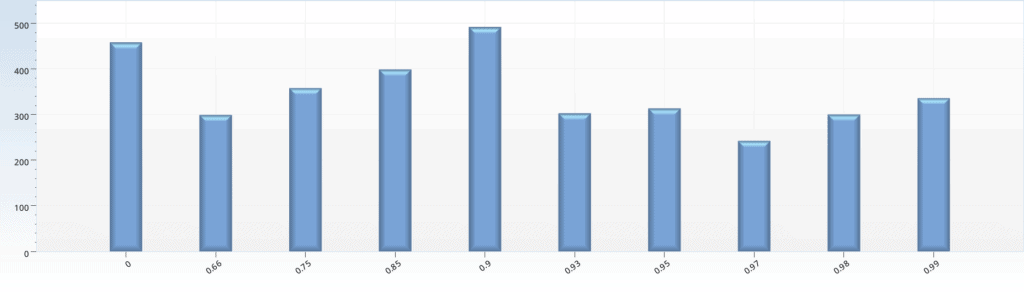
Here we see a less happy picture — the ideal trailing stop varies per security, and often is no stop at all (when the left bar beats all the others). Just to finish out, we try trailing stops on losers, to see if anything there makes us happy.
VLD (Velo3D)
BIGGQ (Big Lots)
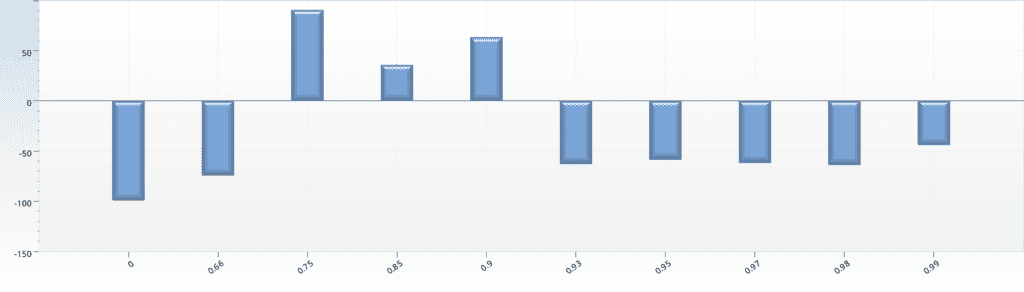
DRYS (Dryships)
BNBN (Barnes and Noble)
Tigher is almost always better, but this is not the blessing it seems, because tigher does not work well for trailing stop for stocks that are going up. So, unlike the fixed stop case, you have to know which direction the stock is going to go to figure out whether to put a stop in or not. Clearly this is less than ideal — if you knew the stock was going to go to zero, you would just short it, or not buy it.