
Can you beat the market?
Is investing random?
Many very smart people believe that stock market investing is essentially random. Under this idea (known as the Efficient Market Hypothesis). If you are one of those people, you probably wonder why we bother having a company named Equities Lab, and why we do what we do. After all, if stock market investment is just a game of dice, then there’s no point in worrying about it; just roll them, or don’t, and move on with life. I attack this problem by knocking over straw-men of increasing plausibility, until I am reasonably convinced. I also get a side benefit: my efforts to make the best random strategy we can, and to compare that to real strategies gives me a way to believe that a strategy I’m working on is not random. So onwards, and let the straw fly.
Can anything be predicted at all?
I sure hope so. It is possible that the sun will not rise tomorrow. It might instead flying off in some random direction because gravity was just a statistical artifact, but if so, this article will have very few readers. I lump Nassim Taleb’s turkey in this category, as well. One may always imagine that the universe only looks predictable as a random artifact of what has happened, but there’s no way to prove otherwise.
If we assume that every apparent pattern is a result of freak chance, we are similarly being skeptical of the act of using reason. If we can’t use reason to figure things out, then there’s no point to reading this article. Go look at cat pictures instead.
Is stock market unbeatable?
The strongest form of the Efficient Market Hypothesis states that all known information is discounted in the stock market. If I assume this, then every stock is just as likely to go up as any other stock — otherwise market actors that knew which stocks would go up would have information not discounted in the stock market. Every investment would be like every other investment. We can model that by selecting stocks by rolling dice. Since every stocks is (investment-wise) exactly like every other stock, we can switch whenever we want, and still model the strong EMH.

Here we pick the 1st random stock each year, on the first trading day of the year. Here’s the heat map of positions taken by our very random and very undiversified investor:

As you can guess from all the red, the results weren’t great. But I want to dig in a bit further. Look at Ross Systems:

By the strong form of the EMH, the market cannot be outdone, and therefore the company is actually worth half as much as from the beginning of the year. That implies that the employees of the company could just look at a stock chart, and figure out that they should leave, as the company is failing. Then, in late August, the company is almost back to its former value. But only for a few days. Then the new equipment, or the new deal, or the new whatever fell apart and the company falls even further. Similarly, the strong form EMH says that Blackstone Mortgage Trust is almost twice the company in 2007 than it was in 2006. This feels absurd to me. I suspect that true adherence to this belief is more a matter of faith than anything else.
OK, can the market be beaten with public information?
The semi-strong form of the EMH states that any public information has been accurately been included in the price of the stock. In this model, no investors can make any excess returns, except for congresspeople, company insiders, spies, and others with privileged information.
The chief difference between this and its cousin, the weak form, is that fundamental analysis is held to be instantly discounted in the price of all stocks, all the time. This gives me a fairly simple lever to test it: compare various fundamental factors against random factors, and see which ones outperform.
Our test rig: long/short by deciles
Our test rig is fairly simple:
- Take the top decile of our factor, and, using 50% of our portfolio, buy an equal weighted position in each of them
- Take the bottom decile of our factor, and using 50% of our portfolio, sell short an equal weighted position in each of them.

We choose a 50% size in each arm to avoid margin interest: if we choose 100% then we pay 0.5% + the daily yield of the 10 year treasury in margin interest on the balance. We also don’t model borrowing costs for the short side, nor lending income from lending out the shares from the long side. We stick with yearly rebalancing for simplicity and tax reasons. In theory, if the two arms have identical performance, the profit line should stay very close to zero, making it a high effort way to achieve nothing.

As you can see, random factors are a great way to get near zero performance, plus or minus half a percent. The plot of the S&P 500 scrolls upwards, mocking our efforts, but providing critical inspiration. Whether a stock is part of the S&P 500 or not is definitely public information:
- The S&P 500 index is published, and updated daily.
- The methodology is public, and published on their website here.
- Numerous mutual funds following the S&P 500 publish 13F reports detailing their holdings.
By the semi-strong EMH, the lines of our random indicator should be about the same as the “IsSP500” indicator. But they are not.
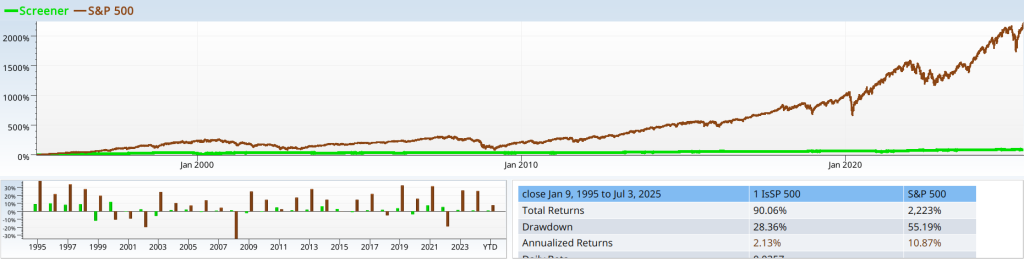
Not only that, but the strategy has been known about for decades. Vanguard (the “father” of index investing), was founded 5/1/1975. Even over the second “half” of the interval, the performance is consistent: the first half returns about 40%, and so does the second half, which just about explains the double over the time interval chosen. Nor is this some random strategy chosen out of thousands. The top 3 ETFs by AUM follow this strategy (long only). They get the results of that brown line I commented about earlier.
Fine, can normal mortals beat the market using fundamental data?
It’s one thing for the secret council of the S&P 500 committee to beat the market, and do it regularly. It is quite another for normal people like you and me to do the same. Do we live in a world where only the market gliterati get to produce alpha, and the rest of us must scrabble for whatever scraps they leave untapped by fees? I say not. What follows is not the culmination of months of hard search and refinement. This strategy was invented in 20 minutes, while writing this article. Fewer than 100 backtests were run. We are still rebalancing yearly, so this strategy is not hard to follow. It fits in one screen of text, so it can be understood by normal mortals.

It trades only S&P 500 stocks, so the stocks chosen are liquid. It needs five years on earnings per share data, which can be found from the SEC or Yahoo finance. And yet, it trounces the S&P 500.
Reproduction notes
The single random stock
The random long/short decile strategy
The long short IsSP500 strategy

Earnings surge in the past
