
🚀 TSLA at RSI 79: What History Tells Us About Rocket Ships Ready to Crash (Or Keep Flying)
Tesla investors are about to learn a brutal lesson that the market has taught dozens of times before.
Forget everything you think you know about Tesla’s future. Ignore Musk’s grandiose $1 trillion pay package. Don’t waste time debating whether a Tesla is worth four times more than a comparable Chinese BYD. Set aside the mounting competitive pressure from legacy automakers who are finally taking EVs seriously. Even ignore the political drama with Trump or the looming death of the $7,000 EV tax credit that has propped up sales.
All of that is noise.
Here’s what matters: Tesla today looks disturbingly similar to dozens of “revolutionary” companies that came before it—companies that commanded premium valuations, inspired cult-like followings, and promised to change the world forever.
And we know exactly how those stories ended.
I’m going to show you the historical pattern that Tesla is following with eerie precision. By examining what happened to companies that shared Tesla’s characteristics at similar market caps and hype cycles, we can predict Tesla’s trajectory with uncomfortable accuracy.
Spoiler alert: It doesn’t end well for current shareholders.
The market has run this playbook before. The only question is whether Tesla investors will recognize the pattern before it’s too late.
TSLA at RSI 79.31
First, let’s decode RSI like you’re explaining it to your cousin at Thanksgiving:
RSI (Relative Strength Index) is basically a “hype meter” for stocks. It runs from 0-100, where:
- Below 30 = “Nobody wants this stock” (oversold)
- Above 70 = “Everyone’s gone crazy for this stock” (overbought)
- Above 75 = “This is getting ridiculous” territory
TSLA’s RSI of 79.31? That’s like showing up to a party at 2 AM when it’s already at maximum chaos level.
🔥 The Truth About High-Flying Stocks Since 2010:
Here’s what actually happens when stocks hit RSI levels above 75 – and it’s not always what you’d expect:
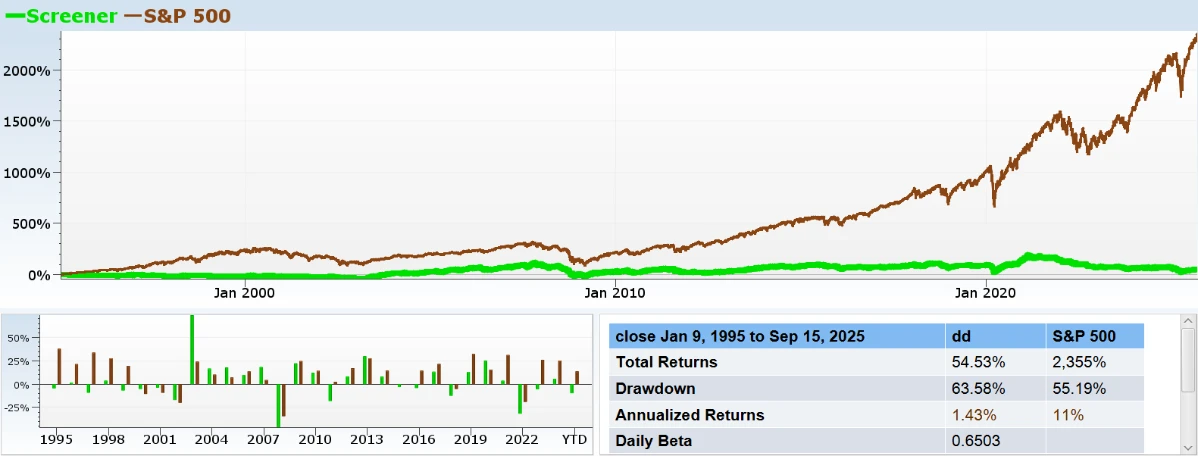
While the S&P 500 grew over 2,300% since 1995, companies that have an RSI of 75 or greater averaged a total return of about 54%, so you are 42 times better off with the S&P 500.
⚡ The Bottom Line: TSLA at RSI 79.31 is like a sports car doing 90 mph in a 65 zone. Sure, it might keep flying for a while, but physics (and market mechanics) suggest you should probably ease off the accelerator.
Tesla didn’t just tickle some technical indicator – it absolutely EXPLODED 20% in one week and is sitting at RSI 79.31.
That’s not a gentle overbought condition – that’s a financial rocket ship that just broke the atmosphere.
So here’s the real question: When stocks go absolutely nuclear like this, what happens next?
The 20% Weekly Explosion Playbook: What History Actually Shows
We’re backtesting the strategy that separates legends from bag holders: chasing large cap stocks that just went absolutely nuclear with 20%+ gains in five trading days.
This is the classic momentum dilemma that every trader faces: when a stock explodes 20% in a week, do you chase it or fade it? It’s the trade that looks either brilliant or catastrophic depending on what happens next. You’re essentially betting that extreme momentum can continue even further, despite all conventional wisdom screaming that you’re buying at the peak.
The data will tell us whether this momentum-chasing approach actually works, or if it’s just an expensive lesson in market timing.
Here’s what actually happens when you buy stocks that just pulled TSLA-level weekly explosions:
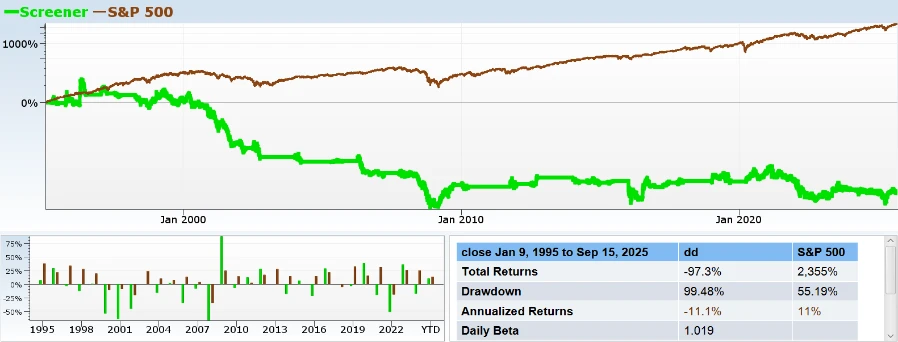
Gloriously horrible.
The Reality Check: Since 1995, if you had systematically bought large cap stocks immediately after they gained 20%+ in five trading days, you would have lost 97% of your money.
That’s not a typo. Chasing these explosive moves has been financial suicide for nearly three decades.
.
The Fundamentals
Forget about the week’s explosive surge for a moment. Strip away the momentum and RSI noise, and look at Tesla through a purely fundamental lens. What you’ll find is a collection of warning signs that should make any value investor’s blood run cold.
Tesla’s fundamentals are flashing some massive red flags right now. But here’s the million-dollar question: How have other large cap stocks performed historically when they displayed these same warning signs?
Since 1995, we’ve seen this exact pattern play out repeatedly with household-name companies that looked unstoppable – until they weren’t. Let’s examine what happens when large cap darlings start showing these fundamental cracks:
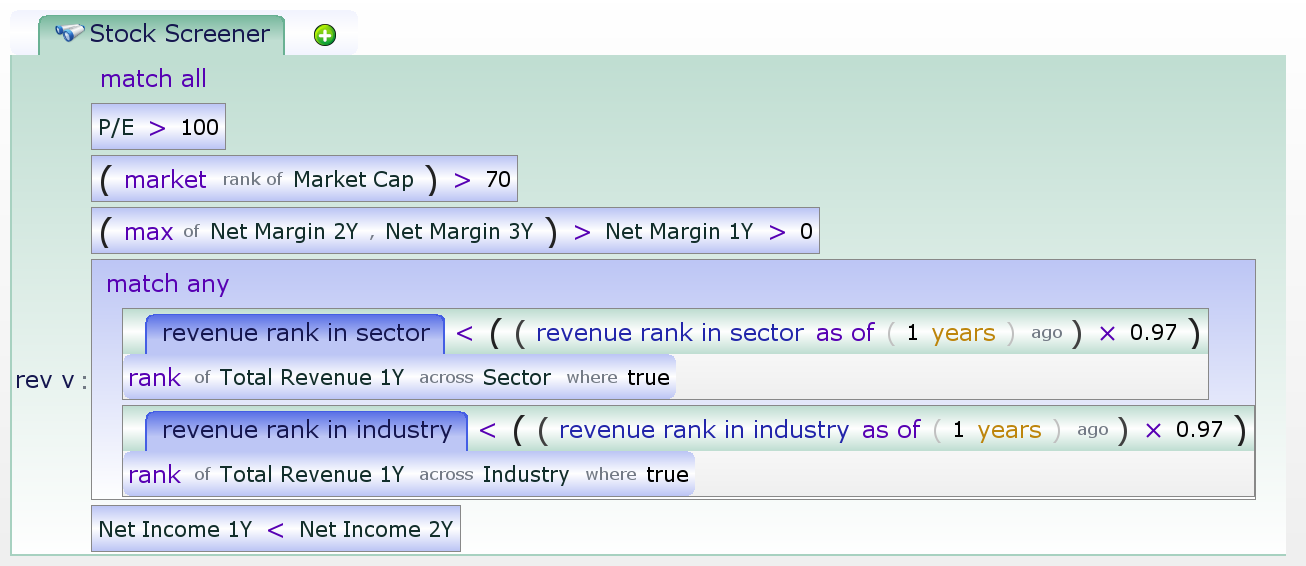
- Extremely High P/E Ratios – Priced for perfection and beyond
- Net Income Lower Than Last Year – Making less money than before
- Profit Margins Shrinking – Getting less efficient, not more
- Revenue Rank Below Industry or Sector – Lagging behind competitors
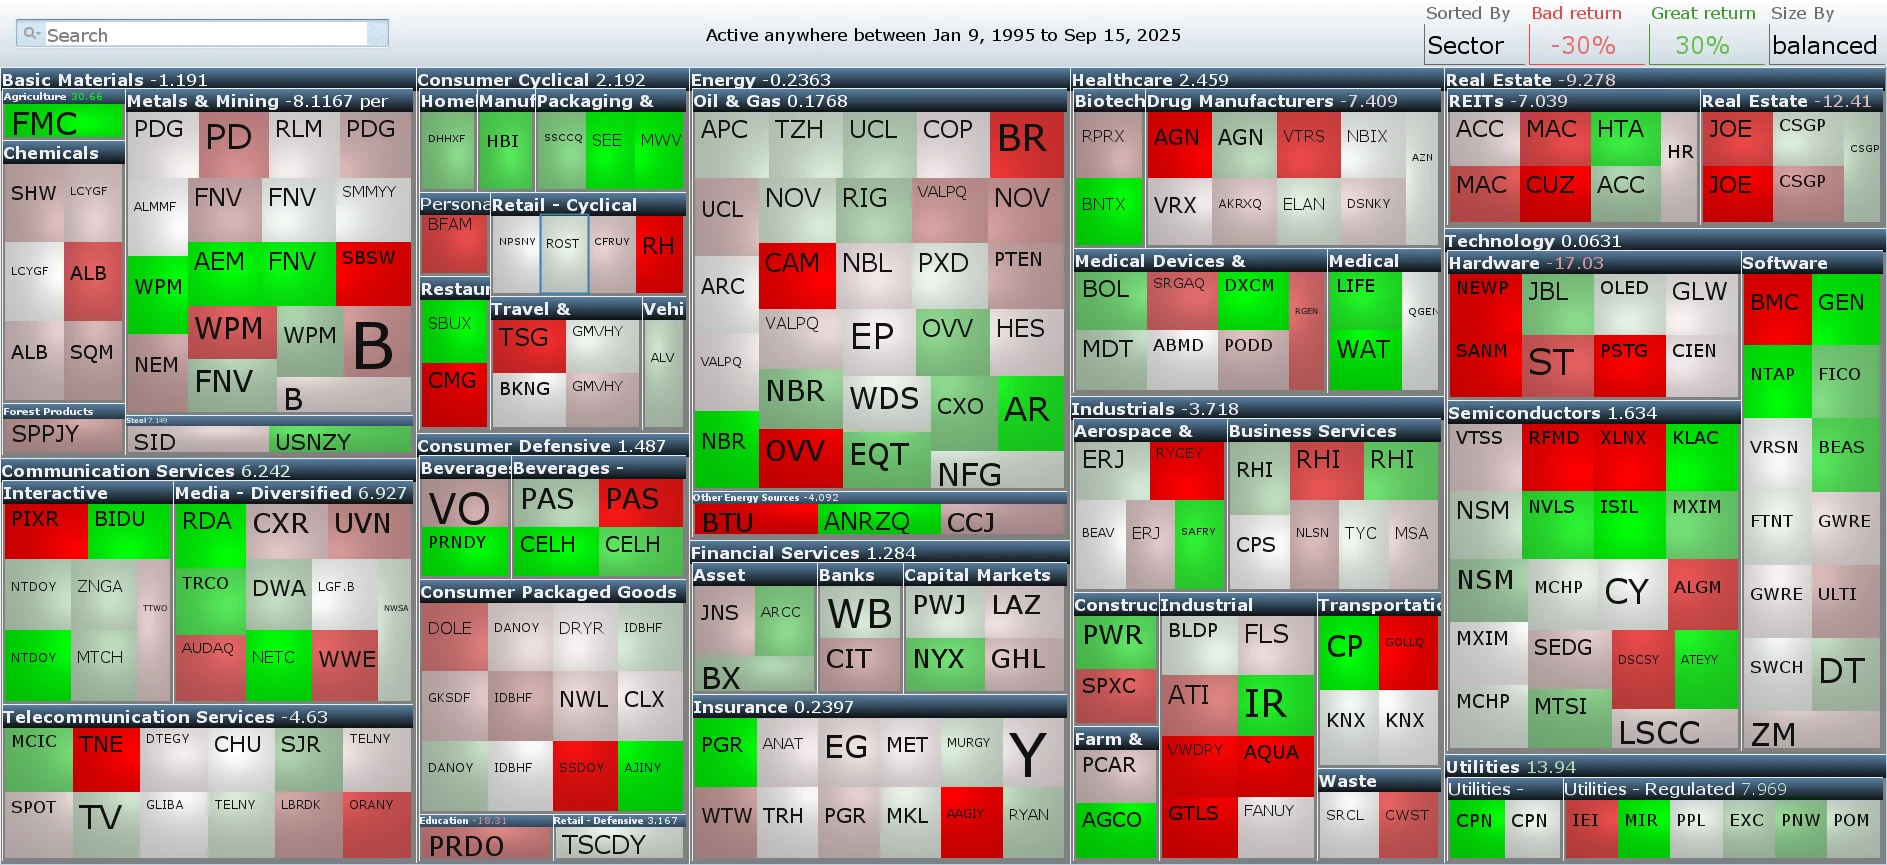
For those of you who enjoy looking at the nitty-gritty, here is the backtest term and matching companies from 1995
Backtest Results
| Close Jan 9, 1995 to Sep 15, 2025 | ||
|---|---|---|
| Total Returns | -81.16% | 2,355% |
| Drawdown | 89.6% | 55.19% |
| Annualized Returns | -5.3% | 11% |
| Daily Beta | 0.9378 | |
| Annualized Alpha | -15.77% |
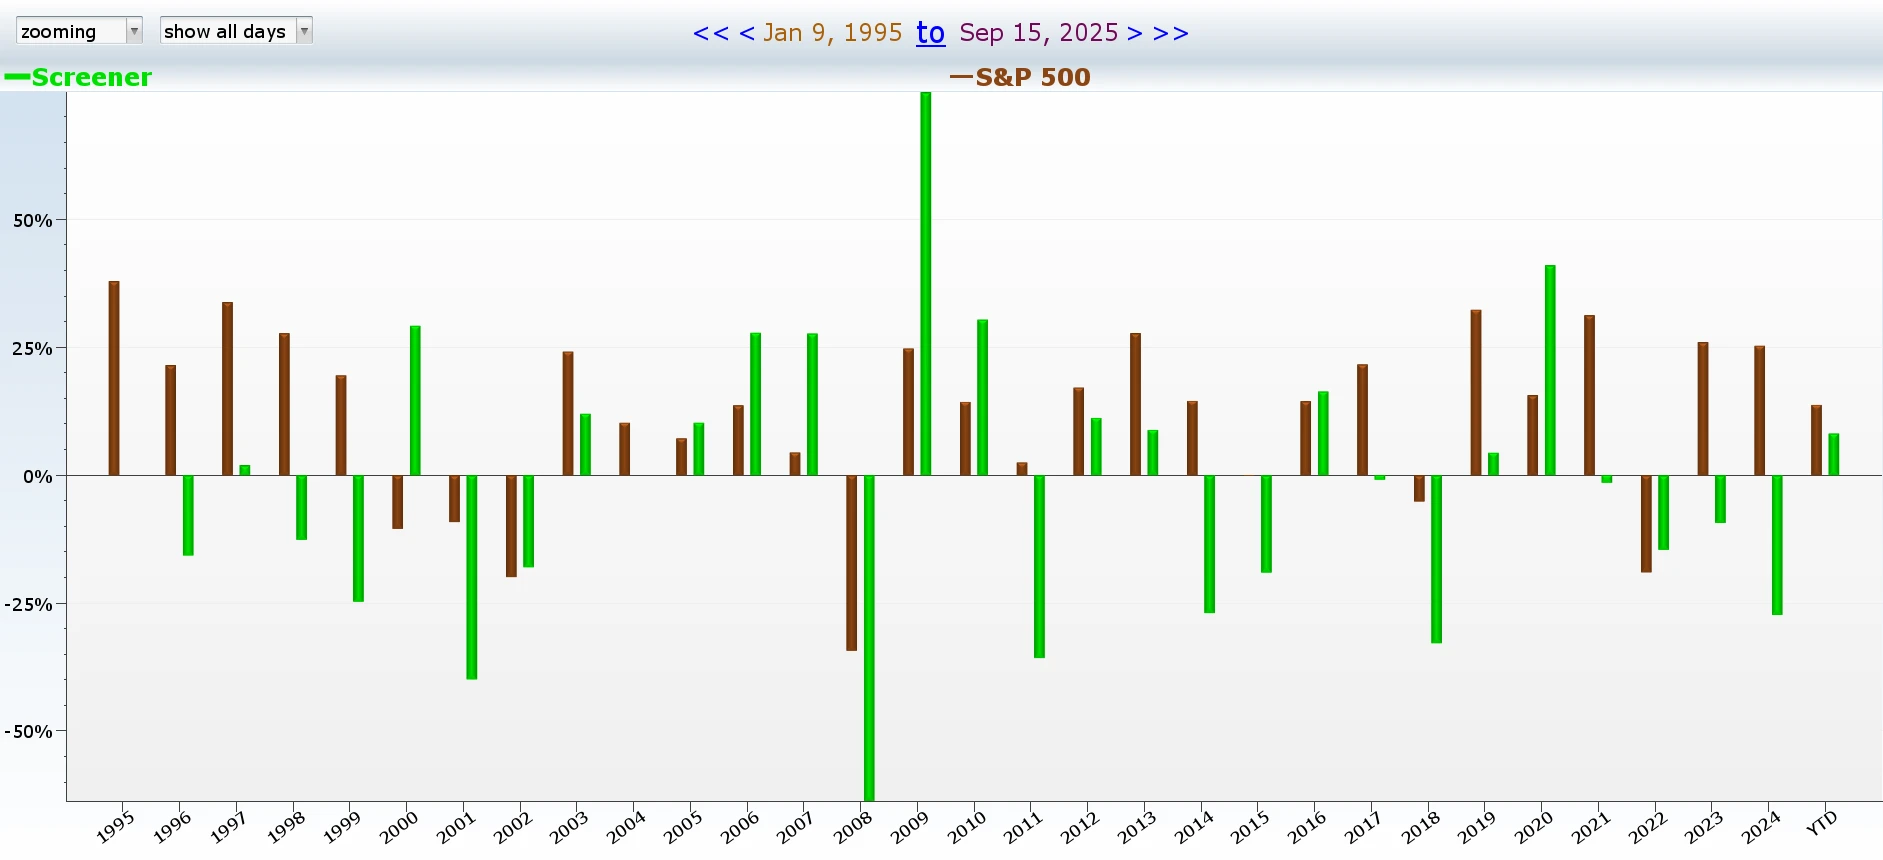
The Bottom Line Reality Check
If you’d systematically bet against stocks showing all these red flags since 1995, you would have lost 81% of your money.
Here’s what makes this so maddening: there were golden years where this strategy absolutely crushed it – 2009 and 2020 were legendary for anyone shorting fundamentally broken momentum stocks. These occasional jackpots create the dangerous illusion that you’ve cracked the code.
But that’s exactly the trap. The market has this sadistic habit of staying irrational just long enough to bankrupt the rational investors. Fundamentally garbage companies can rocket higher for months or even years, powered by nothing but hype, hope, and FOMO. By the time reality catches up, most short sellers have already been liquidated.
Sometimes the market simply doesn’t give a damn about profit margins, P/E ratios, or declining revenues. It just wants to party, and it’ll keep the music playing until someone trips over the power cord.
The Final Verdict: All Roads Lead to One Conclusion
So where does this leave TSLA at RSI 79 after its 20% weekly explosion?
Here’s the thing – when you strip away the noise and look at both the technical and fundamental evidence, they’re actually telling the same brutal story.
The Momentum Data: Chasing stocks after 20% weekly explosions has been financial suicide since 1995, destroying 97% of investor capital. Even the most explosive momentum eventually meets gravity.
The RSI Warning: At 79.31, TSLA is sitting in the danger zone where historically, stocks with RSI above 75 have delivered crushing losses as detailed in “Tesla’s 1.2 Trillion House of Cards: What History Teaches Us About Hype Stocks.”
The Fundamental Reality: Large cap stocks with TSLA’s exact warning signs – sky-high P/E ratios, shrinking margins, declining income, and underperforming revenue – have averaged 80% losses in the long term.
The Historical Pattern: Whether you’re analyzing momentum, RSI levels, or fundamentals, the data points to the same outcome. These triple-threat setups don’t end well.
The Uncomfortable Truth: TSLA’s 20% surge isn’t a breakout – it’s potentially the final gasp before a spectacular unwind. The RSI of 79 isn’t showing strength; it’s showing exhaustion. The fundamental deterioration isn’t temporary noise; it’s structural weakness being masked by hype.
Bottom Line: The momentum signals, RSI warnings, and fundamental analysis are all flashing the same red warning light. Sometimes the market makes it complicated, but TSLA right now? All signals are pointing to sell.
The only question left is whether you’ll listen to the data or get seduced by the rocket ship show.