
How does the S&P criteria work?
Introduction
The S&P 500 has performed so spectacularly that some find its performance hard to believe. Are the stocks that make up the S&P being cherry-picked to only show the most successful performers? If the contents of this benchmark are not selected organically, its usefulness is suspect. If not selected impartially through a repeatable algorithm, how can these stocks represent a baseline “safe” investment?
You can test this by manually screening for the stocks within the S&P based on its selection criteria.
criteria to be an S&P 500 stock
According to Standard&Poor’s website, an S&P 500 stock must meet the following requirements:
- Last quarter earnings and the sum of the last four quarterly earnings must both be positive.
- Annual trade volume must meet or exceed the market cap.
- 12 months have passed since the initial public offering.
- US-based. The company trades on a US exchange, a plurality of its assets are US-based, and the headquarters are in the US
- The company must be a corporation that issues common stock. It cannot have multiple share structures.
- Unadjusted market cap is at least $8.2 billion.
- The IWF is at least .10.
Of the tickers listed in the NYSE and NASDAQ, the top 500 that meet these criteria make up the S&P ranked by market cap.
How do stocks that meet these criteria perform?
To emulate the S&P, let’s create a screener which approximates the S&P 500 by searching for the following:
- Positive returns for the last four quarters.
- Annual trade volume >10% market cap.
- Has been traded for 12+ months.
- Are not REITs, limited partnerships, or ADRs.

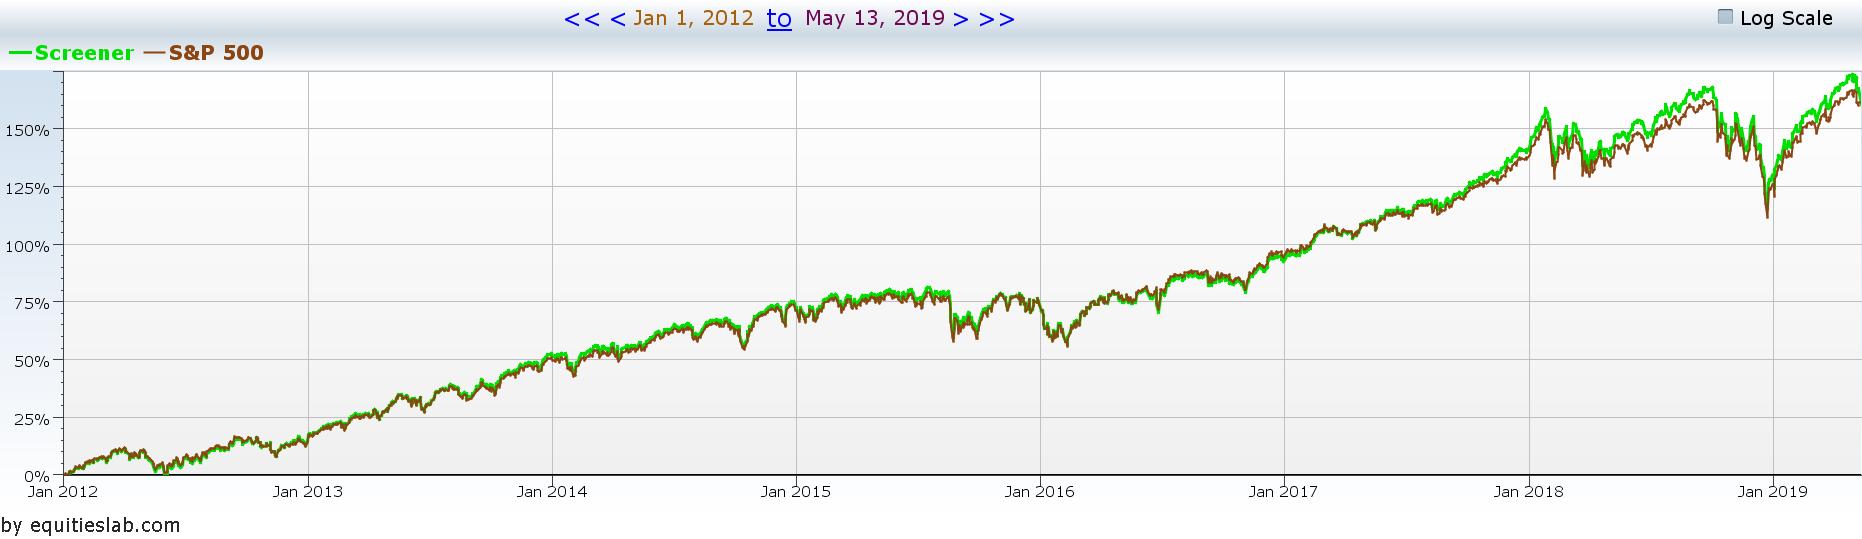
Equities Lab has a built-in macro, “issandplike”, that screens for these criteria. We’ll use this macro and search for the top 500 tickers by market cap. This will give us a list of stocks very similar to what is included in the S&P. If we backtest over the years right before the covid pandemic, we get reasonably similar results.
At least in the short term, the official S&P follows our algorithm very closely. Total returns differ by less than 1% and annualized returns by five-tenths of a percentage point. If we look at the graph, we see also that our approximation moves with the index. Not only are the returns matched, but the maxima of our screen correspond almost exactly to those of the benchmark. What about in the longer term?
Long Term Results
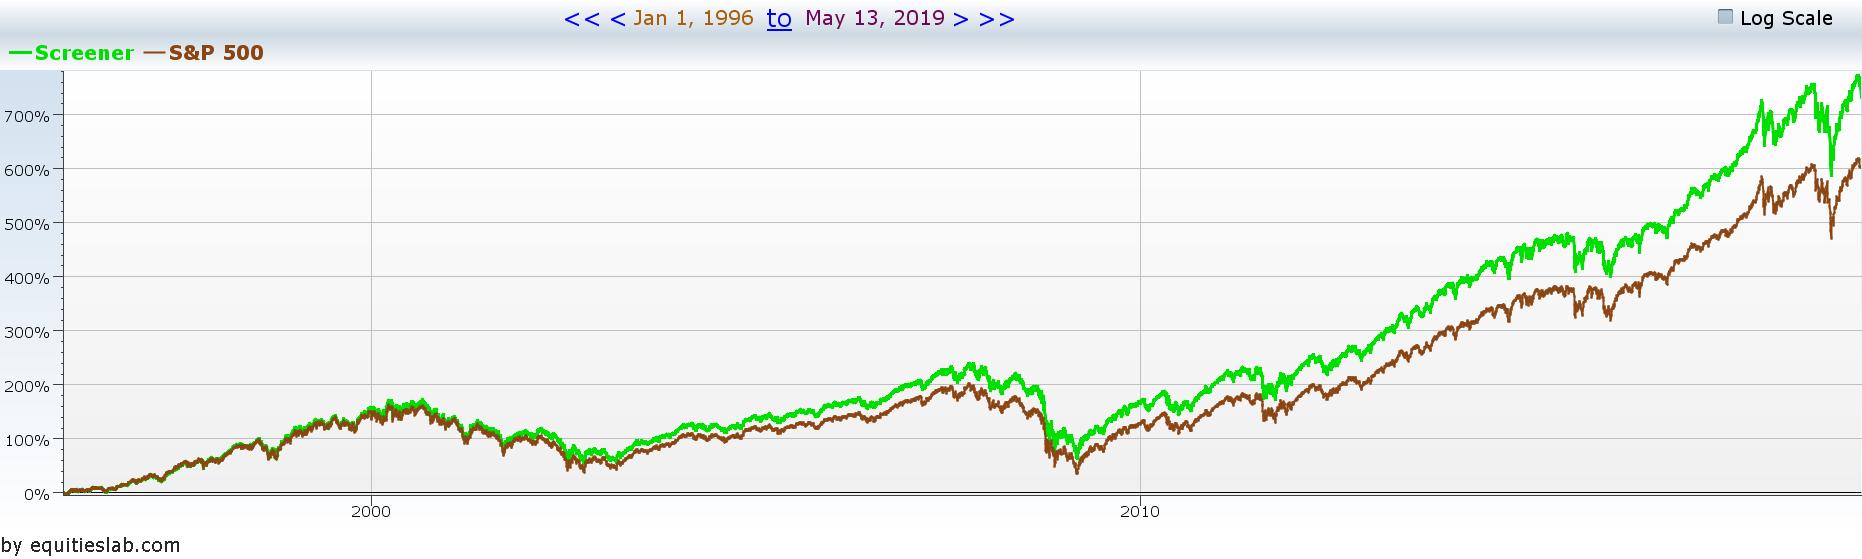
If we backtest from 1996, our approximation is slightly less accurate. It still tracks the S&P, and annualized returns are within .25% of one another, but it mildly overperforms in later years. This is still more than close enough for estimation, but the question remains: why is there deviation at all?
For various reasons, Equities Labs’s macro eliminates certain types of firms rather than test certain excluded criteria. Excluding REITs and LPs excludes equities that aren’t truly corporations whose shares aren’t bought by the public, thereby substituting the IWF minimum. This is roughly analogous to meeting those excluded S&P requirements.
We also don’t include a market requirement, per se, and we don’t require a particular number of shares to be traded yearly. The reason for the market cap filter’s lack is obvious: we take the top 500. Adding a market cap filter means the index will behave oddly during crashes and booms (How does the S&P 343 sound?). Requiring a fixed number of shares to be traded causes issues with companies that split and abruptly enter or leave the index. The Market cap weighted dollar volume cap seems much more sane.
Of course, some “wrong” stocks will slip through, and some appropriate stocks will be excluded, as this is an estimation. We did make a few tough decisions, after all. But in a pinch, this is of no consequence–you get results within the margin of error for less work. And that’s exactly what this macro is for.
Fortunately for investors everywhere, this inaccuracy proves that the good folks at Standard&Poor are being honest. If the estimate outperforms the benchmark, then clearly, no one is cherry-picking stocks to inflate the S&P.
Why choose the S&P 500?
We have established that the S&P 500 is legitimate and indeed measures what it claims to measure. But why does the S&P make its gold standard off of benchmark investments?
Why not something else?
The answer is obvious. The S&P performs much better than the entire market, and all large-cap stocks. However, outperformance cannot be our only standard for a good benchmark. The Dow 30 has nearly always yielded higher returns than the S&P, for instance. Why not index against the Dow, instead?
The Dow 30, while being a well-performing set of companies, only comprises 30 stocks. Moreover, Dow’s algorithm emphasizes high closing prices, not just market cap. This limits its scope to companies that are both large and high-value. Because the 30 largest companies with high stock prices cannot accurately reflect how the economy as a whole performs, they cannot be the basis for a market index. What if we took this line of reasoning to the extreme? Amazon has outperformed the S&P and the DOW since its inception. Does that mean we should use it as our benchmark? The problems with doing so are self-evident; clearly, there is more to metrics than outperformance.
Why the S&P?
Now, let’s consider the S&P’s requirements. With a minimum market cap of 8.2 billion (which changes over time), Mom and Pop’s corner store won’t make it onto the index. However, this is more than generous enough to allow mid-cap regional or niche firms onto the index. The average consumer has likely never heard of several of the companies on the S&P. However, this cap is still large enough to limit the index to mostly competent firms. Other prerequisites, such as positive earnings or the time since IPO, serve the same purpose. By eliminating companies that perform poorly or whose price is still speculative, the S&P creates a best-case scenario.
Another point to consider is the IWF requirement. The “Investible Weight Factor” is a major part of the free-float methodology. This is a measure of market cap that emphasizes the total equity available to the public, over the raw market cap. The greater the portion of publicly-traded stock, the higher the IWF. The importance of ensuring a high ratio of publicly-traded stock is twofold. The first is that market trends more heavily affect publicly-traded stocks, as their primary traders are market actors. For an index that seeks to gauge the state of the market, the benefit is obvious. Second, a greater IWF corresponds to lower volatility. If most of a firm’s equity is not publicly traded, the number of stocks determining its price is small. Any one buyer or seller will have a major impact on the stock’s price, meaning the price will fluctuate wildly. Market benchmarks are supposed to be stable. Avoiding volatile stocks allows the S&P to better represent the market.
By minimizing fickle chance and incompetence, it reflects the economy’s ideal potential, meaning that a shift in the S&P should represent a shift in the economic reality, not one or two (un)lucky firms or sectors. Generously allotting 500 slots makes sure the index includes the good and not just the exceptional. The US headquarters requirement limits it to domestic firms. The public’s hands requirement, combined with a float-adjusted market cap, limits it to truly public companies. All of these factors combined ensure the S&P tracks the US economy but without the uncertainty from outliers.
Don’t let perfect be the enemy of good enough
To emulate the S&P, we can create a screener which approximates the S&P 500 by searching for the following:
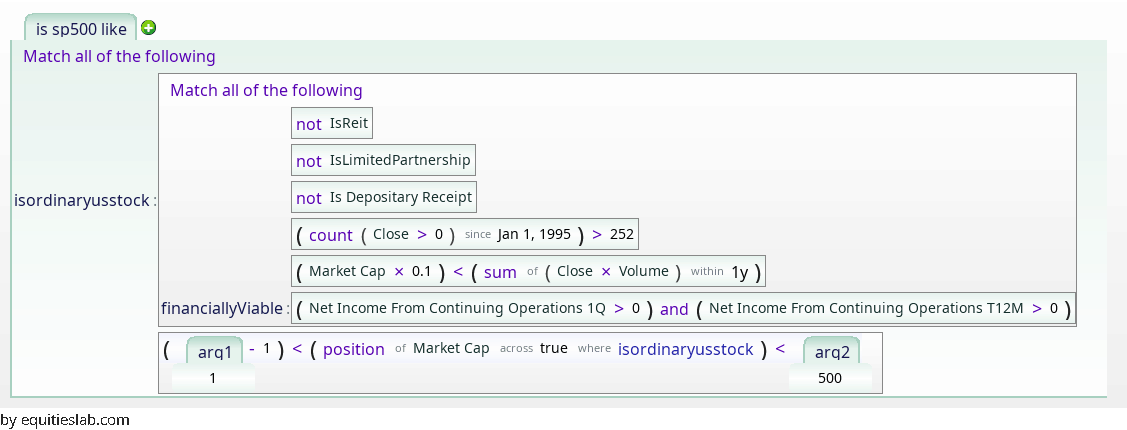
The formula used to capture S&P likeness
Astute readers will note that these are not the criteria used by Standard & Poor’s for their index. This is in the interest of computing time and ease of information access. For instance, rather than going through the odious process of determining a ticker’s IWF, we eliminate certain company types. REITs and LPs are not truly corporations and are not typically traded by the public. By excluding these companies, we nearly match the IWF requirement for a fraction of the processing power. We also don’t include an explicit market requirement or a minimum number of shares. Implicitly, however, the ability to select a range makes these requirements superfluous. There is no need to filter by the market cap when you’re only looking at the top 500 (for example) stocks, after all.
With positions sized by market cap, the S&P likeness gives very similar performance to the S&P 500.
A quick backtest of the issandplike macro from 0 to 500 confirms that our estimation closely tracks the S&P.
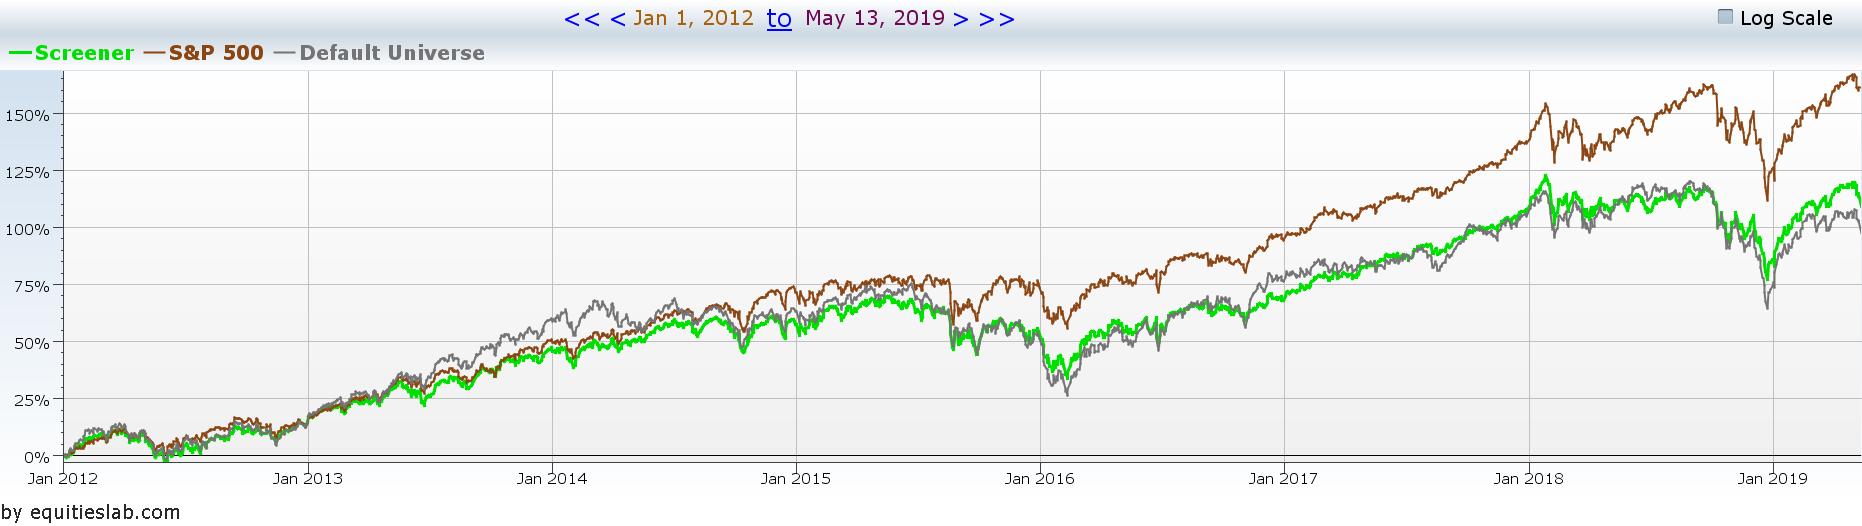
500, 600, 900, oh my!
As mentioned above, this macro isn’t limited to the S&P 500. Equities Lab includes formulae for the S&P 500, the MidCap 400, and the SmallCap 600. We also include their most common composites–the 900 (large cap+midcap), the 1000 (midcap+smallcap), and the 1500 (all three benchmarks together). If the standard divisions aren’t to your liking, Equities Lab makes selecting your own range a trivial matter. All three of these indices use the same core methodology–only the market caps are different. As a result, the issandplike macro can be used for any range in the market index. We can try this now:
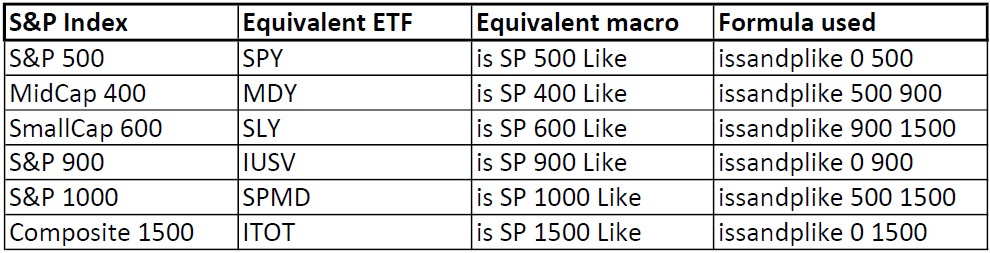
Open Equities Lab and create a new screener. Import the macro by typing $issandplike into the editor. There will be two blank spaces in the term for the range; we’ll select 343 to 780.
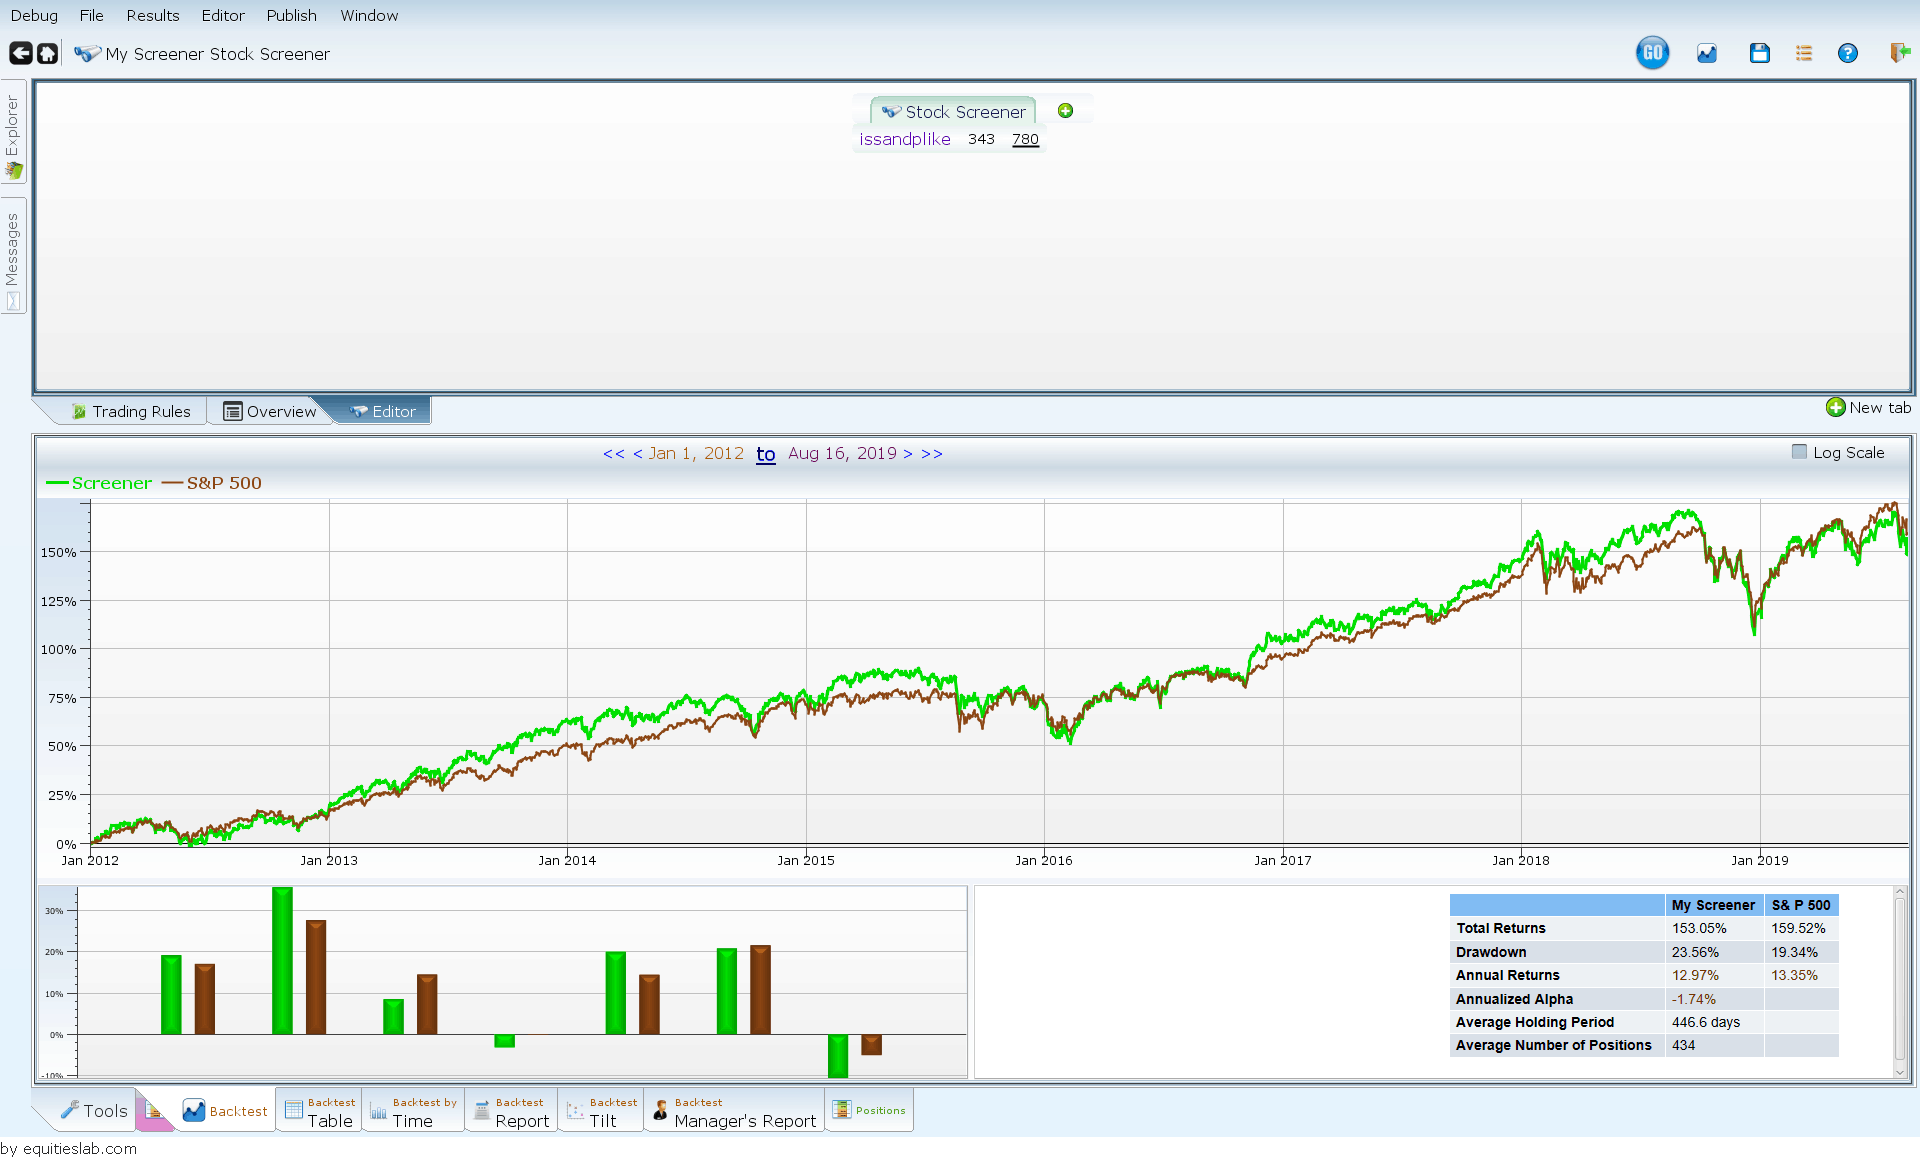
Backtesting reveals that our range tracks the S&P 500, as expected, but not perfectly. We can get it closer by adding a quick tweak; weighing the positions by market cap. This weighting brings the screen more in line with the S&P, but isn’t included in the default macro (it can generate odd results depending on how it’s used).
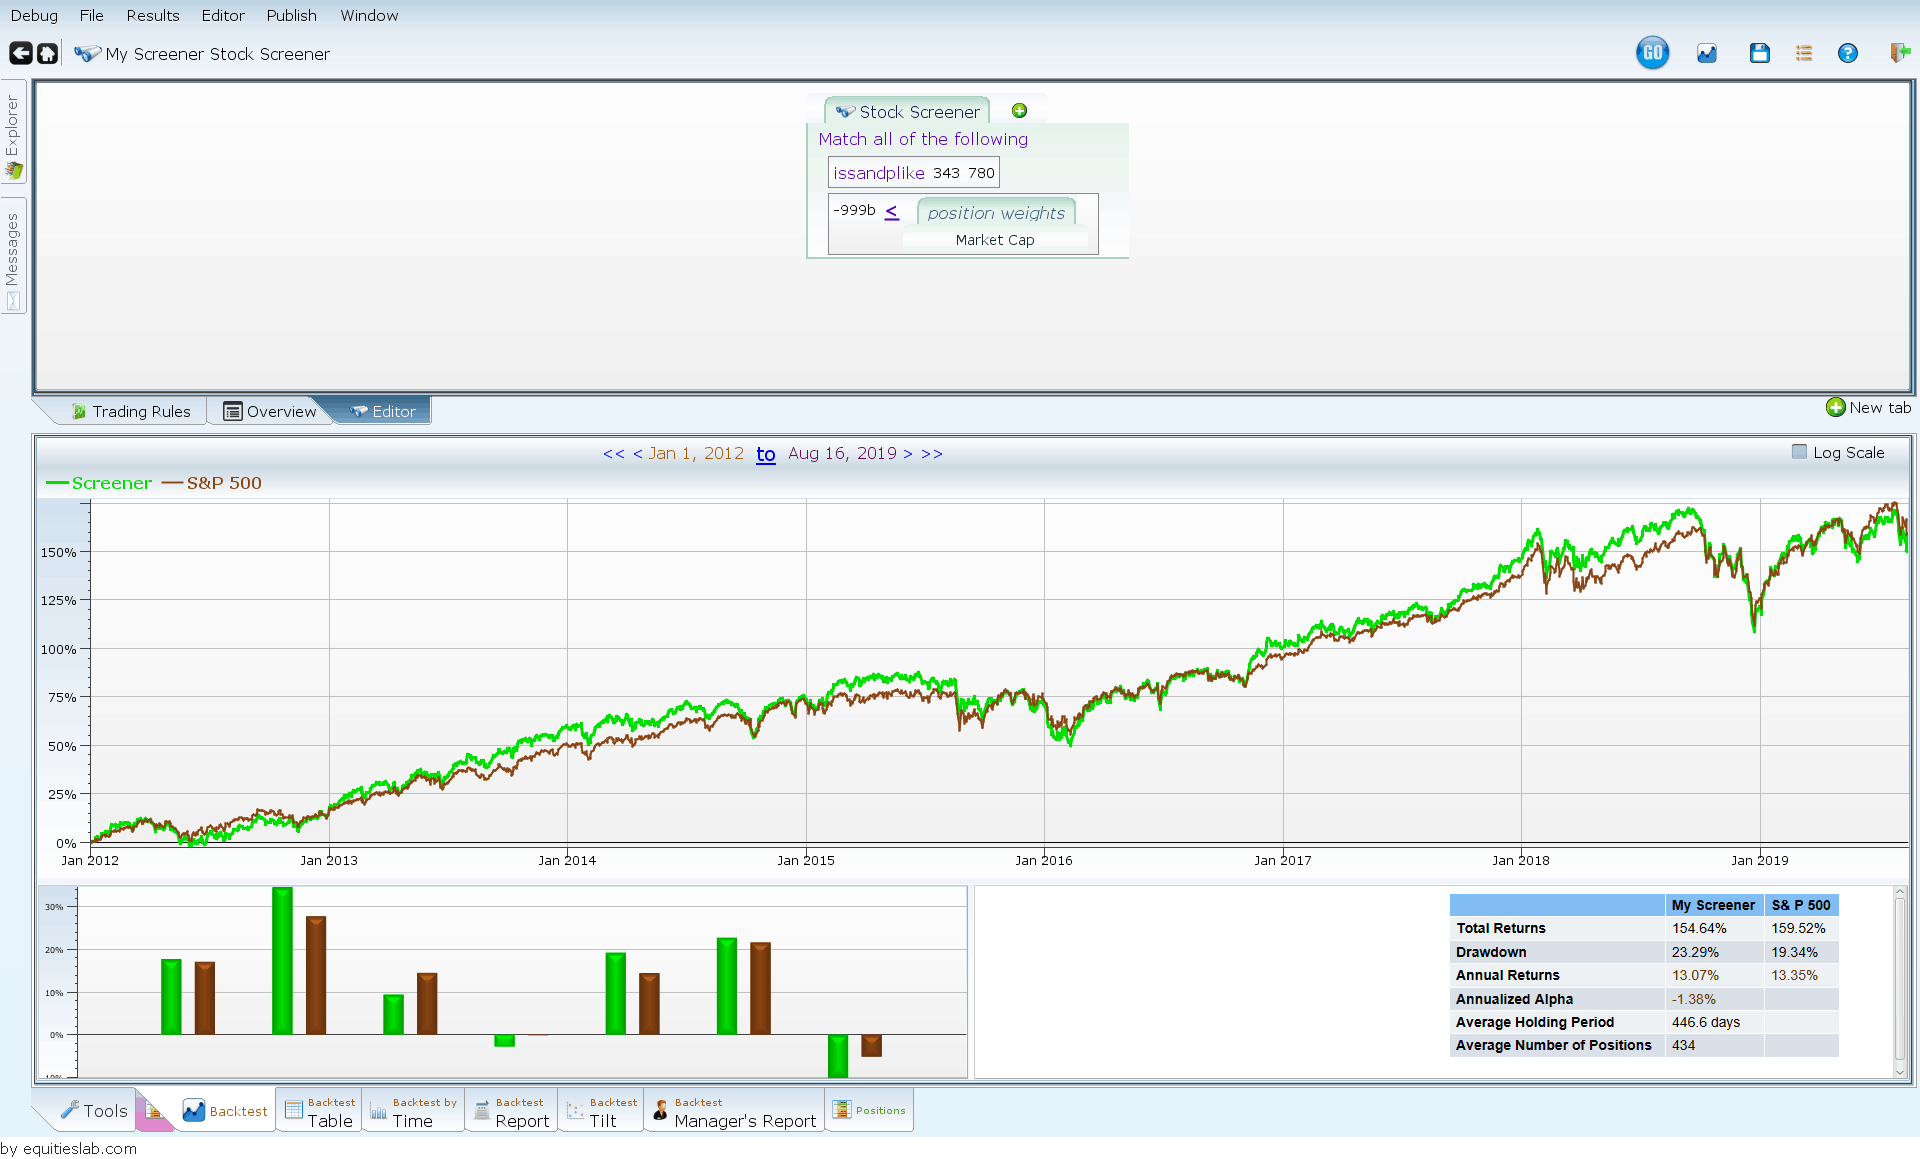
As the backtest shows, weighing by market cap gets us a bit closer to the returns of the S&P–annualized returns differ by less than a third of a percent.