
Why Are Quantitative Investments Wise?

Quantitative investment is quite a mouthful – seven syllables. Why is it even worth caring about? We’re going to break it down into manageable pieces.
Why Invest?
Investment is the art of forgoing current pleasure to gain something more tomorrow – at least in theory. Squirrels invest: they bury nuts for the winter. Humans invest all the time – even for as trivial a thing as standing in line to buy Starbucks. Nobody particularly enjoys the standing in line part of the process: it is all about the coffee at the end. Who hasn’t had the experience of going to a coffee shop, waiting 20 minutes in line, and finally fuming at the terrible cup of coffee at the end? Some coffee is better than other coffee. Think of this coffee metaphor as a way to explain investing.
What Are Quantitative Investments?
Quantitative investing is the short way of saying, “Making your life easier by doing what you already do faster,” but using seven syllables. There are massive amounts of data, and using algorithms or formulas to understand that historical data to invest is called quantitative investing. Yes, there are more components to quantitative investing, and things can get complicated once you start building screens to match certain parameters and completely eliminate the human element from your portfolio, but the end result is worth the effort.
How Do People Typically Invest?
Most people invest the same way they buy coffee: they go to the nearest (or most convenient) coffee shop and throw down $4 for a latte. Consumers typically buy coffee from that shop day after day, making it predictable. The same behavior can be applied when investing early for future returns. They see something near, familiar, or convenient, and they invest.
Why Does that Strategy Not Work?
When people approach investing by picking stocks that are near, familiar, or convenient and then just buying them, they are waiting in line for a potentially bad investment/coffee. A practical way this strategy comes up is when people invest in single ticker investments. There is no strategy, no thorough process, and it isn’t considered a wise investment. To overcome that, they can visit pages like bticoin embassy.
Becky Buys Stock Like She Buys Coffee (Single Ticker Investment)
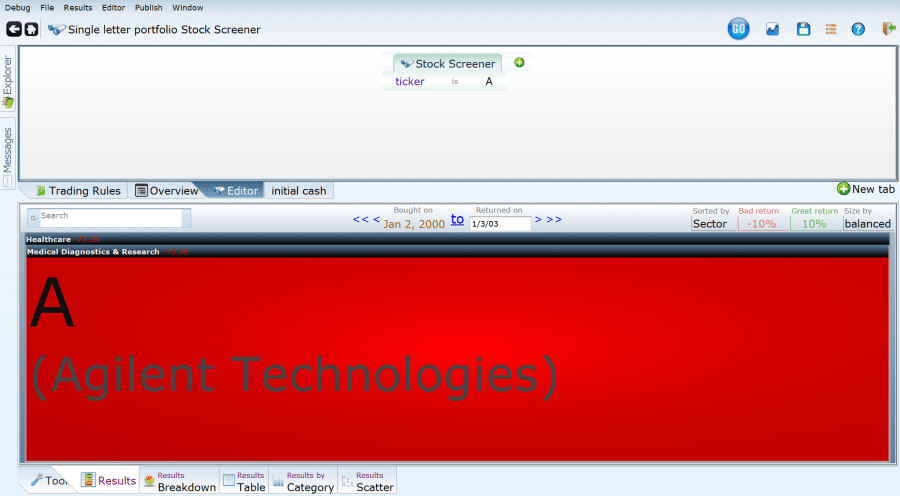
There’s a girl named Becky who decided to buy Agilent stock, which is displayed below using Equities Lab software. The purchase of the Single Letter Portfolio isn’t benefiting Becky, and here’s why.
Why did Becky buy stock in Agilent Technologies? Maybe because it starts with A, she heard some positive things, potentially because Cramer pitched it, or she just liked the name. Basically, Becky buys stocks like she buys coffee, flippantly.
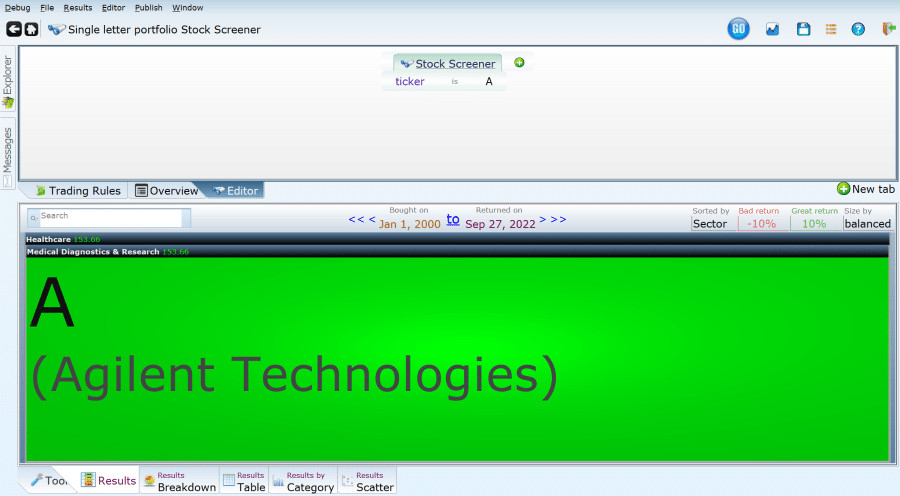
When Becky initially invested, every dollar she put in on January 1st, 2000, returned 150%, meaning that $1 became $2.50 by the present time. That is 22 years for that particular stock to grow, which is a large amount of time. It might seem like the rewards are worth it, but are there better options?
Imagine if Becky decided to buy coffee from a shop because of how long a shop had been open, instead of evaluating the quality of the coffee. There has to be a better way!
Evaluating Based On 1 Year, Not The Entire Existence (Single Sticker Investment for A Year)
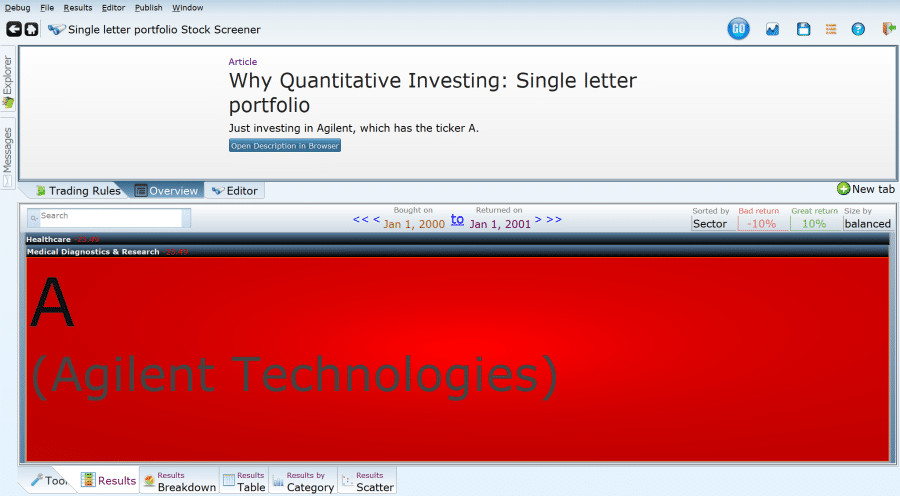
If Becky had planned out buying stock more intentionally, she would’ve learned the following information. If she focused on one year of Agilent, from 2000 to 2001, she would get the below results. That red means she lost 23%, so her $1 turned into $0.76, but it has to get better right?
Nope, it got worse for Becky! She lost 42% from the years 2001 to 2002 (the below image)! If she were trying to get coffee like this, the shop would definitely not be open. But it has to get better, right?
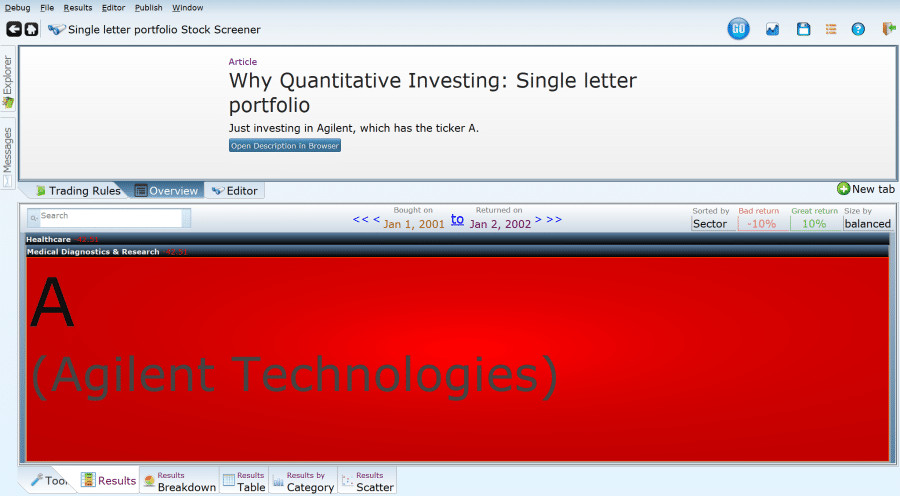
Nope, it gets way worse! From the years 2002 to 2003 (the below image), the stock continues to plummet by 38%. Why did Becky get this stock? Well, she got it because the overall ticker for the company seemed positive, but the reality is the stock was not a good investment.
How to Screen Multiple Years
Is it possible to screen multiple years at once? Using Equities Lab, you can cough up that number faster than you can say thrice, which Becky didn’t do.
Simply adjust your stock screen “bought on” date back to 2000, while leaving the “returned on” date as 1/1/2003. The below image is the information spanning three years. If you look at the number next to Medical Diagnostics, you will see -73%, meaning the stock lost three-quarters of its value over those three years. Why oh why didn’t Becky do her research?
If we look at the red number in the bottom next to Medical Diagnostics and Research, we see that they lost almost three quarters of their value over the period. Simply brilliant. We could also get that information (and more) by clicking on the giant red box.
How to See Even More Performances Years Through Time
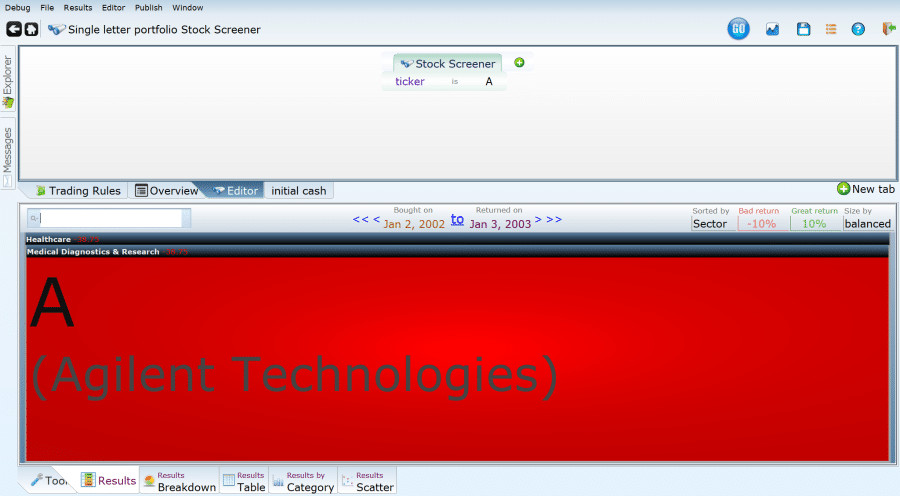
Becky should’ve been using Equities Lab’s software, but just because she didn’t doesn’t mean you shouldn’t. Although evaluating for those three years was informative, it was off tedious. Here’s how you can see the performance each year in just one place rather than adjusting for all those dates.
- Create a new tab by using the
button or Ctrl T)
- Name it initial_cash
- Set the value to 100000 (meaning it will be set for $100,000)
- Next, you will need to specify the time period for your screener.
- To specify the time, click on the
tab (middle left of the screen).
- Find the Rebalance Quarterly button, and click on it.
- Click on Rebalance Yearly 01/01, meaning the screener is rebalancing to every January 1st.
- Backtest the new information (use the
button in the upper right corner).
- Before hitting run, a new dialog box will be created, you need to adjust the yearly range.
- You adjust the yearly range by clicking on the date range boxes,
, and adjusting it to 2000.
- Click on “Run.”
- Click on the Positions tab (
in the lower right).
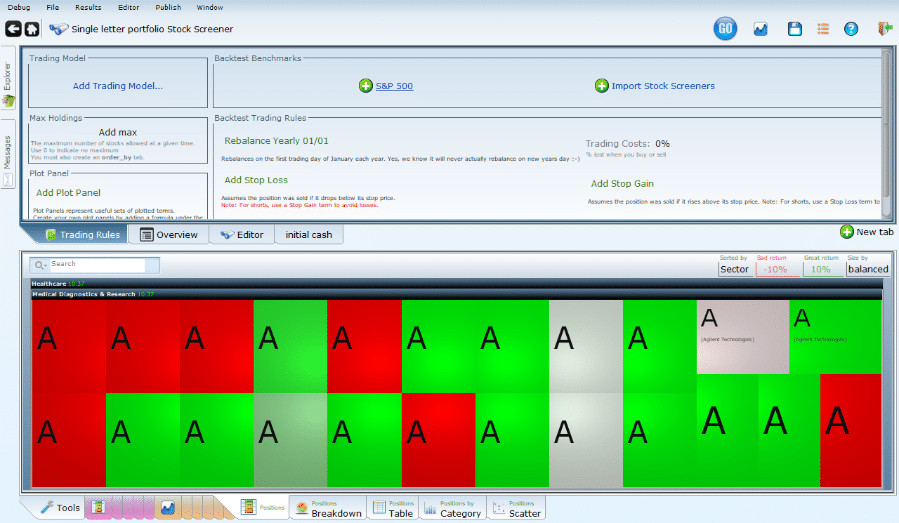
The below image should pop up! Happiness is a collection of single-year studies that are displayed for easy viewing. You can see that Agilent had a terrible first few years. After that, the stock settles into mostly years of good performance, with a few stark exceptions. Hovering over the boxes will reveal which ones are the exceptions. It should be no surprise that 2008 was awful: -55%.
Back to Quantitative Investments!
Why should you use quantitative investments? Because you don’t want to be like Becky! Becky made an investment on a whim, but you want to make investments that are based upon the solid information about stocks you’re interested in. To do this, you may consider using robot trading services; find out about robot trading here. Are you interested in forex trading? Click the link to learn how FXIFYfx Futures can help you in your trading journey.
Equities Lab wants to assist you in creating stock screeners through backtesting that will evaluate stocks based on years and years of data. Don’t miss out on the powerful software that will make quantitative investments a breeze.
If you’re serious about refining your trading strategy, it’s important to ask, what is the VWAP indicator? The Volume Weighted Average Price (VWAP) is a crucial tool that helps traders determine an asset’s average price throughout the trading day, taking both price and volume into account. Many institutional investors rely on VWAP to execute trades efficiently and avoid significantly impacting the market. By integrating VWAP into your investment strategy, you can make better-informed decisions and optimize your trade execution.
With data-driven insights, advanced stock screeners, and a focus on quantitative investing, you can eliminate guesswork and take control of your financial future.