
Cash Flow Score: How to Use When Making Investment Decisions

What is the Cash Flow Score?
The cash flow score is a numerical rating system, ranging from 0 to 10, that assesses the financial health of a company based on its cash flow performance. This score primarily focuses on two key aspects of a company’s financial statements:
Free Cash Flow (FCF): This is the amount of cash a company generates after accounting for cash outflows to support operations and maintain its capital assets. It’s calculated by subtracting capital expenditures from operating cash flow.
Cash Flow Quality: Measure how the cash flow has changed over time, the type of the cash flow, and how the cash flow relates to liabilities.
This score serves as a quick reference for investors, analysts, and stakeholders to gauge the overall cash flow health of a company, though it should be used in conjunction with other financial metrics and qualitative factors for a comprehensive assessment.
The score takes into account various factors, such as:
- The consistency and growth of Free Cash Flow over time
- The ratio of Free Cash Flow to revenue or net income
- The company’s ability to generate positive cash flow from operations
- The balance between cash inflows and outflows
- The company’s efficiency in managing working capital
A higher score (closer to 10) indicates a healthier cash flow situation, suggesting that the company:
- Generates strong and consistent cash flows
- Has sufficient funds to reinvest in the business, pay dividends, or reduce debt
- Is less likely to face liquidity problems
Conversely, a lower score (closer to 0) may indicate:
- Weak or inconsistent cash flow generation
- Potential difficulties in meeting financial obligations
- A higher risk of financial distress
This score serves as a quick reference for investors, analysts, and stakeholders to gauge the overall cash flow health of a company, though it should be used in conjunction with other financial metrics and qualitative factors for a comprehensive assessment.
How To Use the Cash Flow Score
If you type “Cash Flow Score” into the editor box in Equities Lab, you will have access to the formula. You get to input the score you’d like to use. In this example let’s use “9”.

Notice the words appear in orange. This means there is more to the Cash Flow Score than just the words. If you click on it the formula below will pop up.
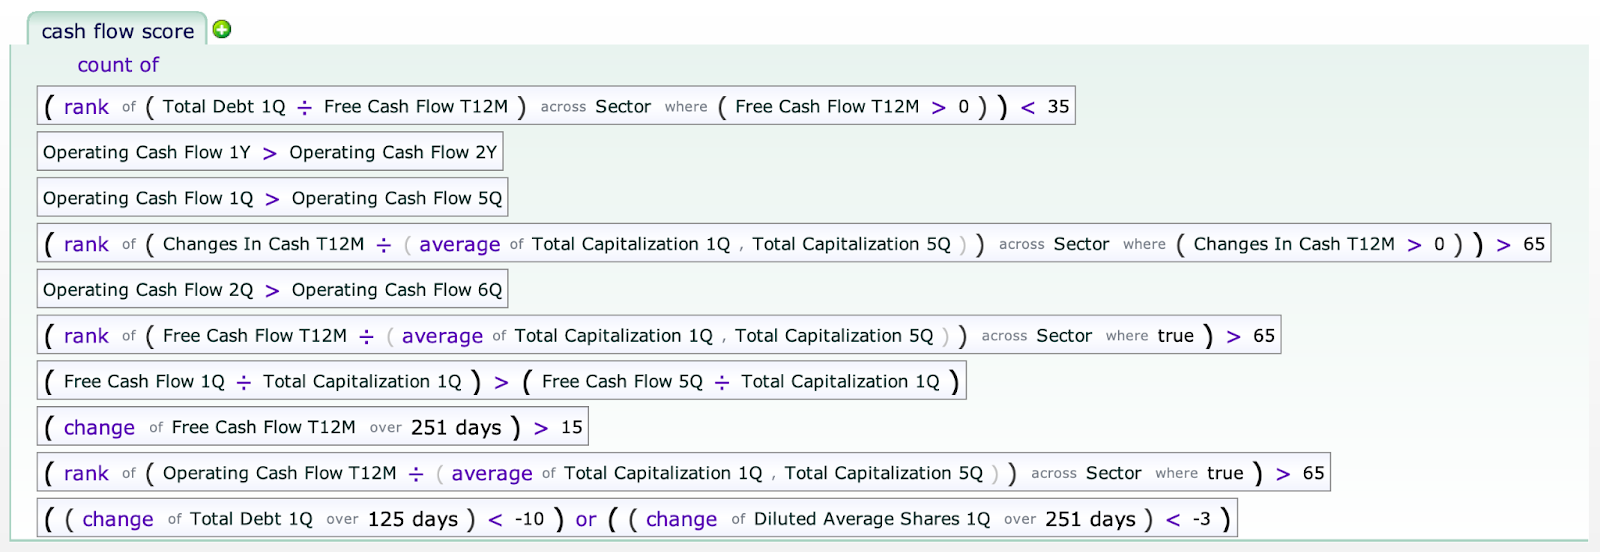
As you can see, it’s a pretty complex formula that allows for a specific analysis with an extremely user-friendly approach.
The Results
The results were calculated from July 30th, 2018 to July 28th, 2023. From a visual indicator, the screener outperformed the S&P 500 for a few moments, then stayed along with it. Maybe the Cash Flow Score approach isn’t the best.

The charts portion reflected the same by showing a dipped Annualized Alpha, meaning it underperformed. However, it did show a low sensitivity with a low Daily Beta # articulating some level of stability.
The return percentage is clear, but it’s good to analyze the strategy from a longer time period.

Results from 20 years
Let’s adjust the results from 2018 to 2023 to see a 20-year difference. Wow, look at the results! The screener is clearly beating the S&P 500 by leaps and bounds.
Why are the results so different? It could be a myriad of reasons, including larger sample size, risk tolerance, Survivorship bias, etc.

The results on the graph look good! The Annualized Alpha is higher, clearly beating the S&P 500. It maintained a low Daily Beta #, so the low sensitivity is consistent.

Watchlists
Now we will take a peak at watchlists to visualize what the formula provides. With a spread across several sectors, we know it must be a semi-solid approach to look at the Cash Flow Score.

After adjusting the visual settings of the chart, there are several green blocks (indicating positive performance) that are larger and more successful than the others. Let’s examine the three largest visual stocks.

Stock Selection
The three stocks selected are EXPI, STRN, and UI. Starting with a return of 464.21%, 250.02%, and 165.75%, respectively. With Equities Lab, you can look up more information about each stock with just one click to outside sources. This feature will reinforce the potential success or any red flags that aren’t visible with just one formula.


Takeaways
Is this a good approach? It is a good component of a good approach. You probably shouldn’t rely solely on these results, but it could be a phenomenal starting point for a winning strategy.
The best part about creating your own screeners is there can be a baseline. Then your own intuition kicks in, and you get to explore a potential opportunity and find great success.
Check out some more sources about cash flow, or contact Equities Lab at sales@equitieslab.com today to start creating your own screeners.