
Find Stocks
Supercharge Your Stock Analysis
Ditch the time-consuming process of building screeners from scratch. Equities Lab empowers you with:
Whether you’re a seasoned investor or just starting out, our screeners provide the perfect launchpad for discovering your next winning stock. Dive into deep analysis without the deep time investment – let Equities Lab do the heavy lifting for you.
- Extensive Pre-built Library: Access a diverse range of ready-to-use stock screeners.
- Customization Freedom: Use our screeners as-is or tailor them to your exact needs.
- Robust Foundation: Each screener combines powerful fundamental and technical analysis.
- User-Friendly Complexity: Despite their sophistication, our screeners are intuitive and easy to understand.
- Flexible Modification: Easily adjust parameters to fine-tune your results.
See our stock screener in action
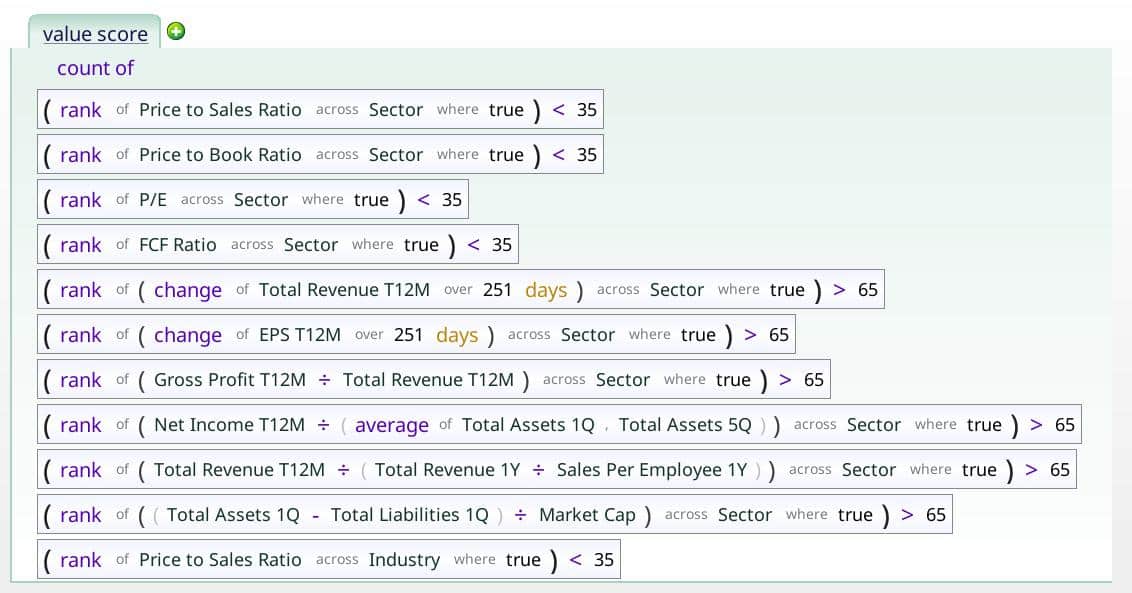
While Equities Lab offers standard features like comparison, selection, and mathematical functions, our true strength lies in advanced operations.
- Basic approach: “Is the P/E ratio below 10?”
- Equities Lab approach: “Is the P/E ratio in the bottom 25% vs other companies in its industry?”
Our method provides deeper, more contextual insights, leading to more informed investment decisions.
The Power of the Count Operator
Flexibility: Captures strong candidates that don’t meet every criterion 2. Realism: Aligns with market realities where perfect stocks are rare 3. Opportunity: Expands the range of potentially profitable stocks 4. Prioritization: Focuses on crucial factors without rigid requirements 5. Adaptability: Helps strategies remain effective as markets change 6. Robustness: Reduces risk of over-optimization to historical data
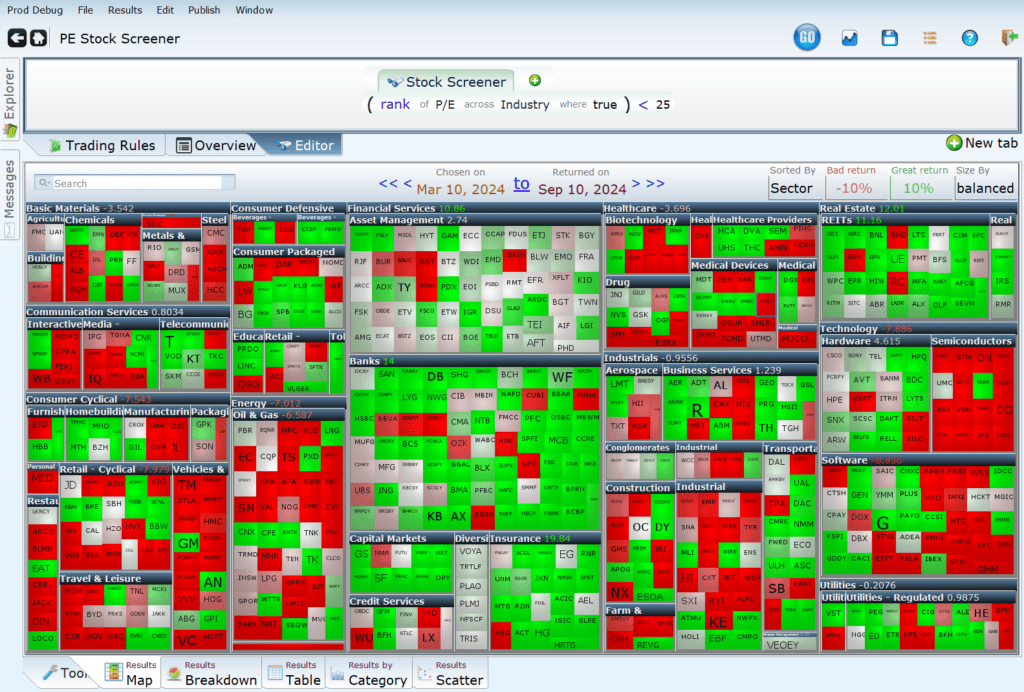
Mastering Large-Scale Stock Screening
When a stock screen returns few results, like 12 stocks, a simple list suffices. You can easily check for industry concentration or cap size manually. However, as the number of results grows—say to 112 or even 1,112+—a basic list becomes unwieldy and overwhelming. The challenge then becomes: How can you effectively analyze and interpret such large volumes of financial data?
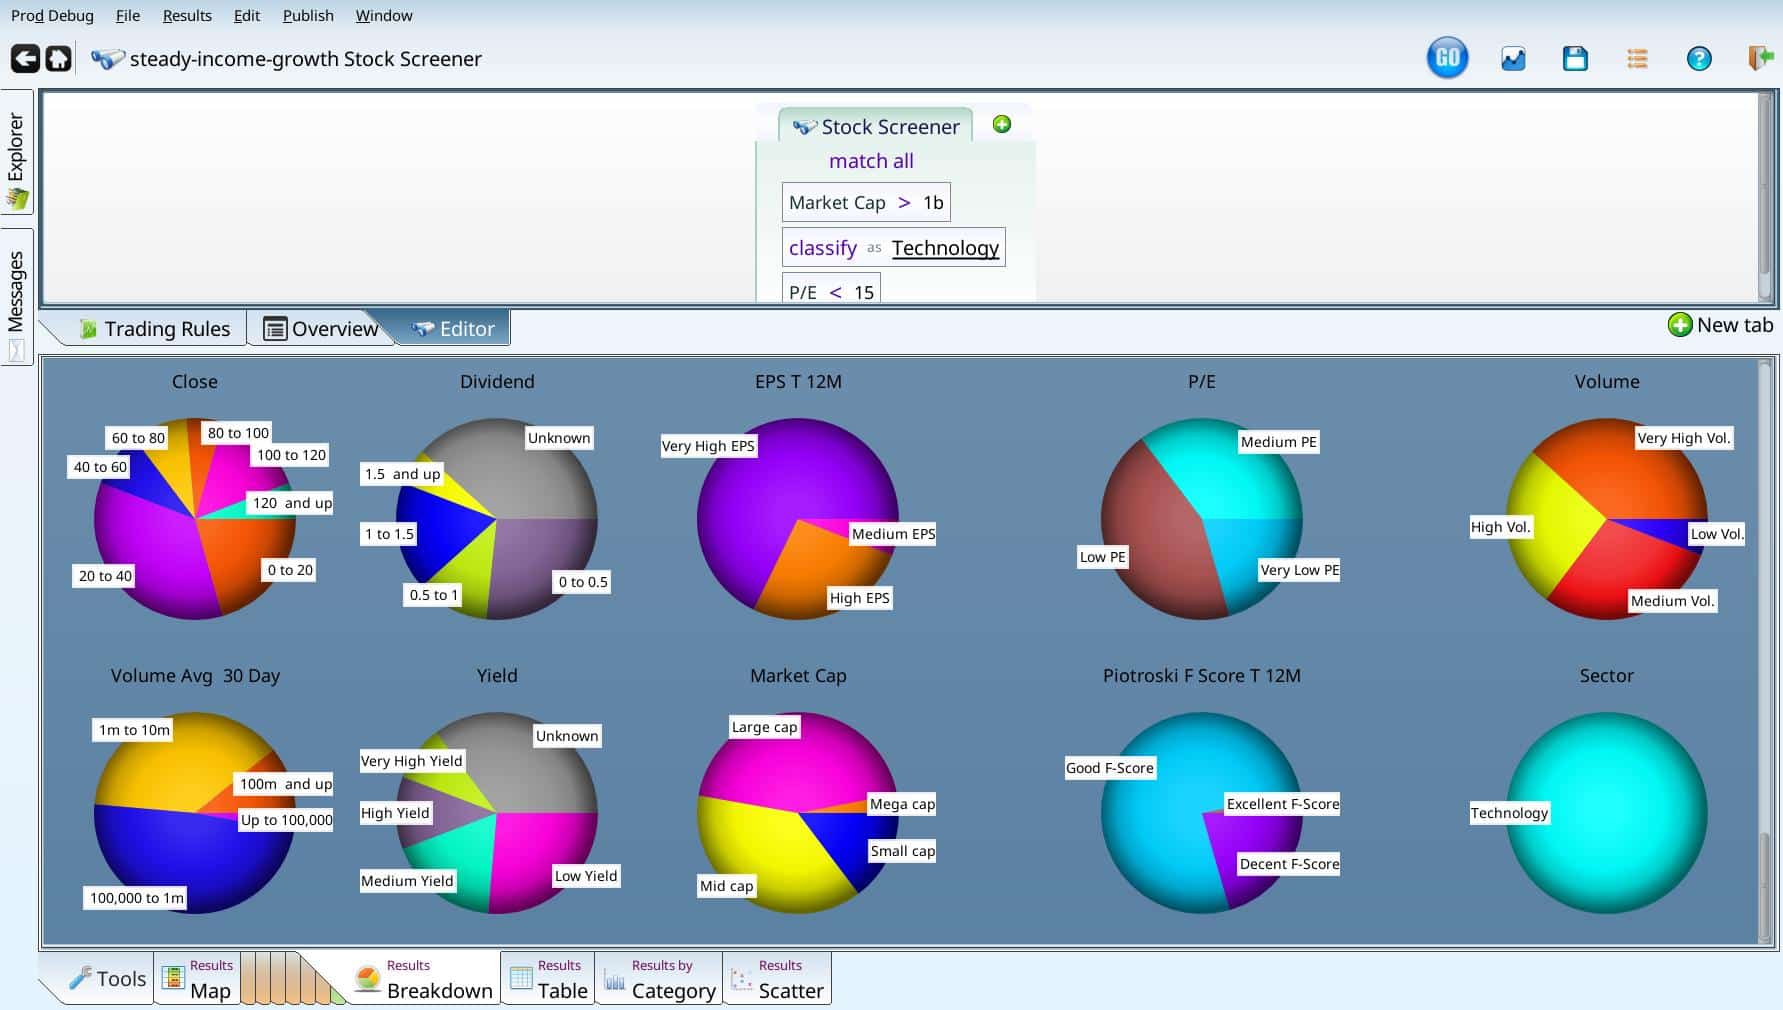
Advanced analytics address this challenge. Equities Lab offers powerful visualization tools—bar charts, sortable scatter charts, and tilt charts—to effectively analyze large datasets. These features help extract meaningful insights, enabling confident, informed investment decisions.
Beyond Basic Metrics: Power Tools for Dynamic Stock Analysis
Equities Lab enables in-depth analysis of metric changes over time, allowing for complex queries like:
- Tracking consistency of key ratios (e.g., P/E)
- Analyzing causes of metric changes (e.g., low P/E due to rising earnings)
- Measuring rates of change in accounting data
For advanced users, we offer sophisticated tools for:
- Statistical analysis: Standard deviations, skewness, variance, correlation, kurtosis
- Advanced modeling: Monte Carlo search logic
These capabilities elevate technical analysis from simple trend identification to nuanced searches, such as finding stocks with lower volatility than peers and consistent growth, excluding recent data.
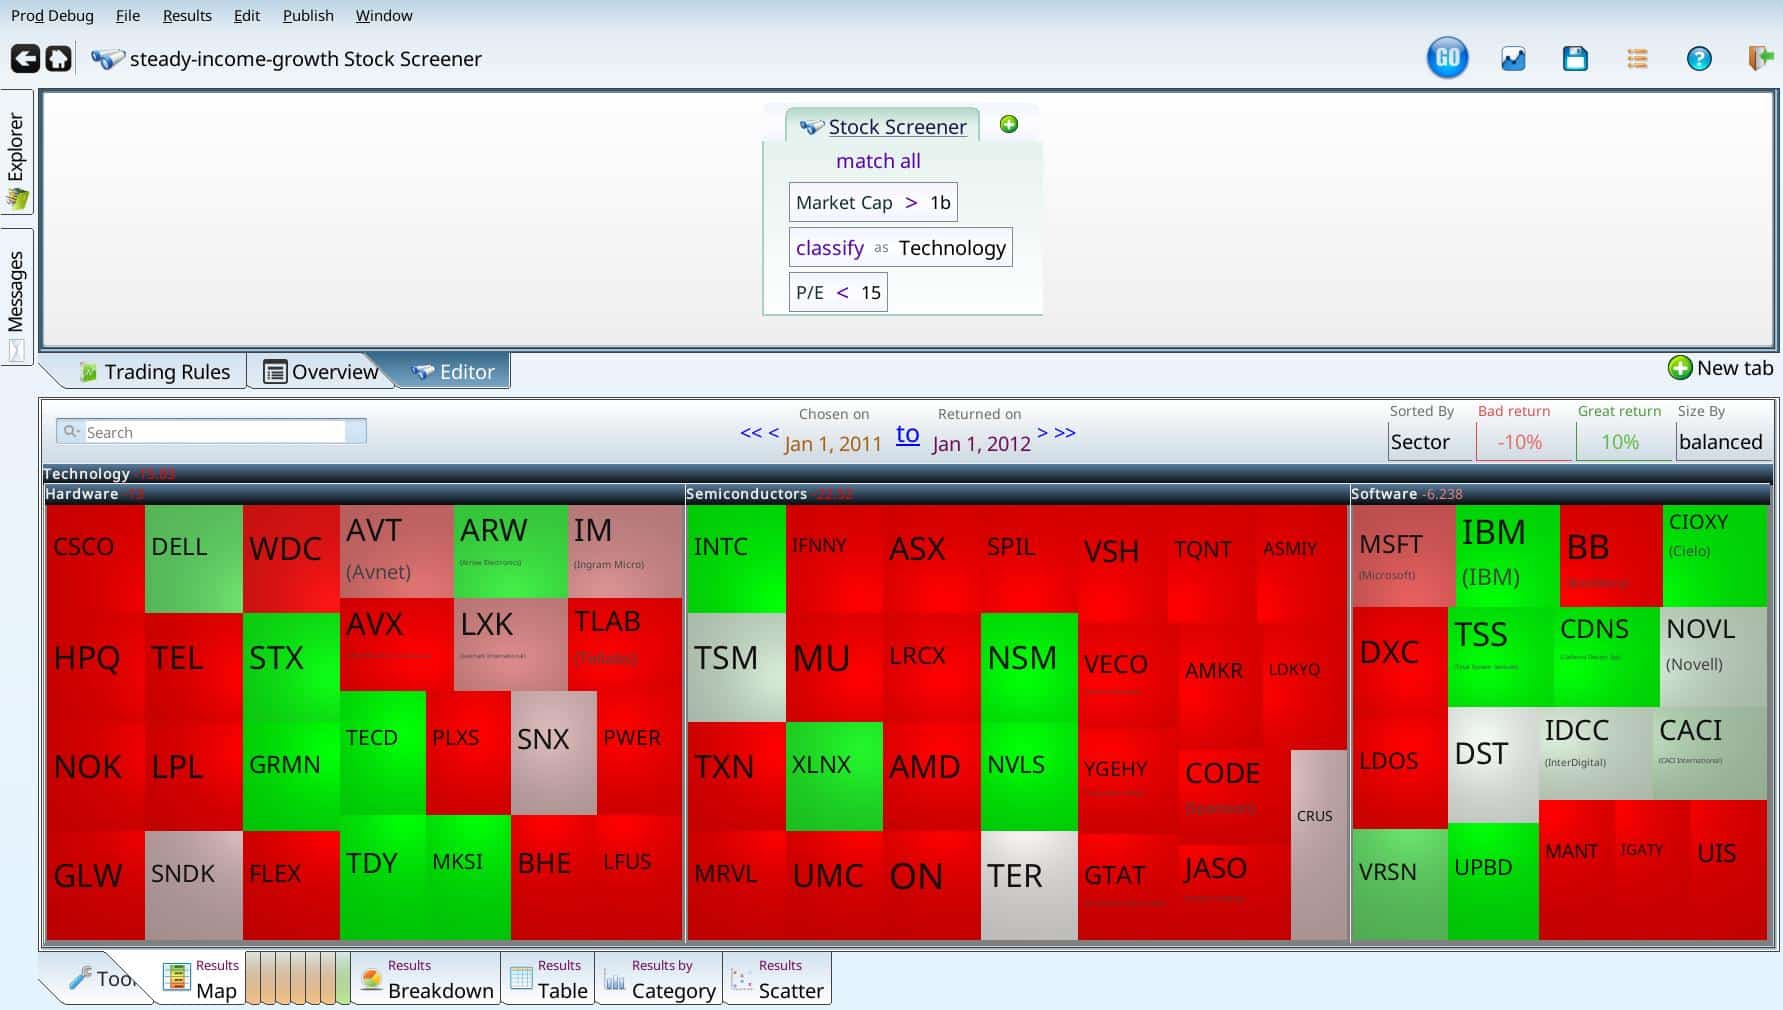
Screening In The Past
While analyzing past performance is valuable, the ability to “travel back” in time and jump around can be immensely helpful and insightful.
With Equities Lab, you can explore historical data as if you were there, allowing you to see what you would have noticed just before the 2008 financial crash and during the recovery in March 2009. This feature enables you to evaluate whether you could have predicted these events. You can also jump to January 2011 and test strategies that might have been profitable during that challenging year. After all, those who do not learn from history are doomed to repeat it!
Screen With Confidence
We understand that navigating all the information available can be overwhelming. That’s why Equities Lab provides sample formulas that you can easily incorporate into your screener, either by name or by copying and pasting directly. If you ever find yourself needing assistance, our support team is just an email away at support@equitieslab.com.
This is serious business—your career, your nest egg, your future—and we recognize that! It’s also empowering, however, (and even enjoyable) to experiment with and explore ideas that you’ve only been able to read about until now. With Equities Lab, you have the tools and the freedom to bring those ideas to life.