
Financial Valuation: Gordon Growth Model
The Gordon Growth model is an offshoot of the standard dividend discount model. As a historical model that is continually taught and respected, what does it even do? Well, this model is used to calculate the intrinsic value of a firm based on the discounted value of future dividends.
Keep reading this article to learn about the equation, how to apply it, and takeaways.
The Equation
At a basic level, the Gordon Growth Model is calculated by:
P = D1 / r-g
- P = The intrinsic price you should pay for the firm
- D1 = The dividend for the next period
- R = The current discount rate. For our purposes, we will use the CAPM for this.
- G = Is the dividend growth rate
How Can You Apply The Gordon Growth Model?
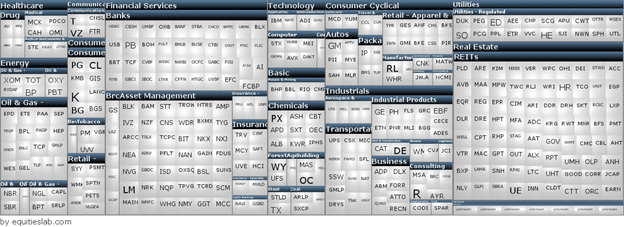
Now you know how this is calculated on a sheet of paper, and if you don’t have the data, there may be some pieces of information that you need to assume. However, what if it was possible to get rid of those assumptions and run this analysis on more than just one company at a time? What if you could run this against the entire market all at once? The image below is proof that you can do all of that!

In Equities Lab, we have run a screener with the only parameter being true. We then plotted the Gordon Growth Model and can now see the intrinsic value of all stocks within the universe. Now, there is one major downside to this model, and it only works with companies that have a dividend. Without a history of dividends, or at least a current dividend, we are unable to figure out future cash flows. Which is important for you as an investor – resulting in an intrinsic value of 0. These companies are not worth zero, but we will need to use a different model in order to come up with their values, which is something we will do in a later article.
The Gordon Growth Model In Equities Lab
So, how do we calculate the Growth Model in the Equities Lab system? Well, for you as a user, you can create a new tab in any screener and “import Gordon Growth Model”, but for a solid calculation, let’s explore the formula.
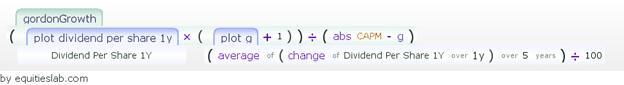
In our system, we don’t make estimations. However, we can extrapolate how much the next period’s dividend is going to be by using entirely historical data. To find next the dividend payment for the next dividend, we multiply this period’s dividend by a growth rate we calculate. For the most accurate rate, we take the average change of the dividend per share for the last 5 periods, divide that number by 100 and add 1 to that number.
Now that we have the dividend for the next period, we need to calculate the CAPM. This is already done in the system, and we talk about the CAPM calculation in our CAPM article. The standard equation doesn’t call for the absolute value of the CAPM, but we have found that it helps the general strategy generate more alpha over time if you take the absolute value.
Everything is finally calculated, and that’s all fine and dandy, but can this model actually be used to generate returns? If not, why is it being taught in school?
To test this, we need a simple, one-line screener. In essence, we want to purchase all companies that seem to be priced lower than what their Gordon Growth Model suggests.
It appears that there are just about 380 companies in our universe that are underpriced according to this model. What happens when we backtest this?
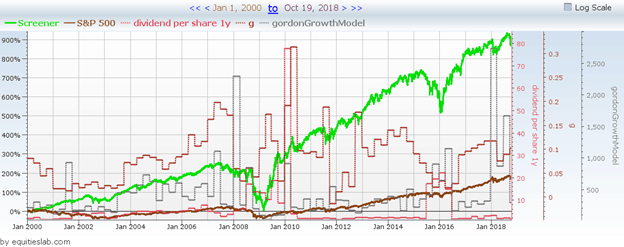
From the year 2000, this strategy did incredibly well by generating roughly 13% annual returns and having a monthly Sharpe ratio of 0.1564. Compare that to the S&P 500’s return of 5.4% and a Sharpe of 0.1086.
However, in previous articles, we’ve found that it’s fairly easy to beat the market over this time frame. What is more difficult is taking a strategy that looks for mispricing, like this one, and using it to beat the more in more recent times.
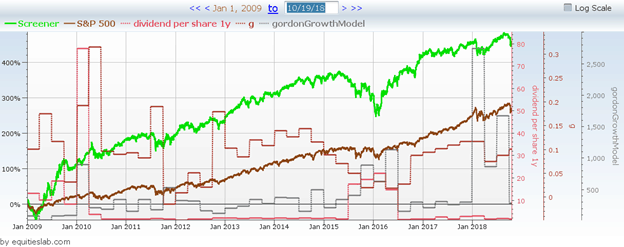
Since the end of the great recession, this strategy has outperformed the market by a pretty significant margin. Now, this does fall apart when you eliminate 2009 from the running, and the same tale of valuepocalypse takes effect.
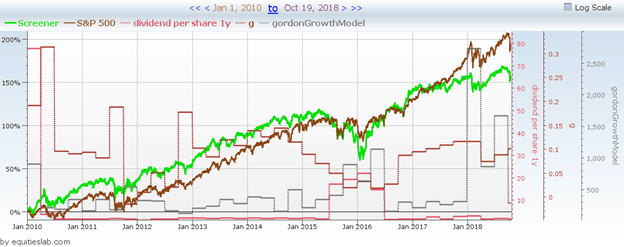
That all said, you can still generate some pretty decent returns with a screen that is only one line.
Takeaways
At the end of the day, the Gordon Growth Model and the accompanying dividend discount models are incredibly important in the valuation process of a company. There is a reason the Gordon Growth Model is taught in virtually every University course as the method for financial valuation. It’s simple, effective, and really helps students understand the part cash flows play when it comes to making an informed investment decision.