
Backtesting
An introduction and explanation of backtesting.
Open the Quick Start: Price Growth Stock Screener

These are securities whose closing prices increased by more than 20% over the past year.
Run the Backtest
Select the Backtest Icon from the toolbar.
A window will pop up summarizing your screener’s trading rules and a date widget for choosing your backtest’s range. By default, Equities Lab backtests from five years ago to the present day.
(After clicking “Run”, notice that you can still “Run in Background” and work on something else in the program while your backtest runs.)
Because Price Growth is a comparatively simple backtest, we won’t use the Run In Background feature, because it won’t take too long to load. Once loaded, the program will show you a graph of your screener and how the stocks performed over the backtested period:
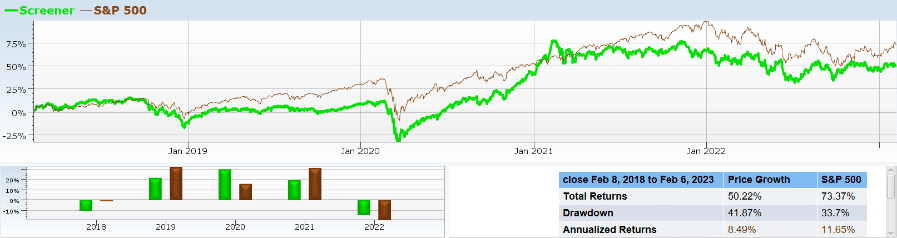
The green line shows your portfolio performance if you would have bought the securities at the start date and sold them when they no longer passed the screener’s requirements. By default, this backtest rebalances quarterly. The brown line shows how the S&P 500 performed during the same period, allowing you to compare your portfolio’s returns to the S&P returns. While our screen does get positive returns, it failed to outperform the S&P.
Backtest Table
Switch over to the backtest table tab.
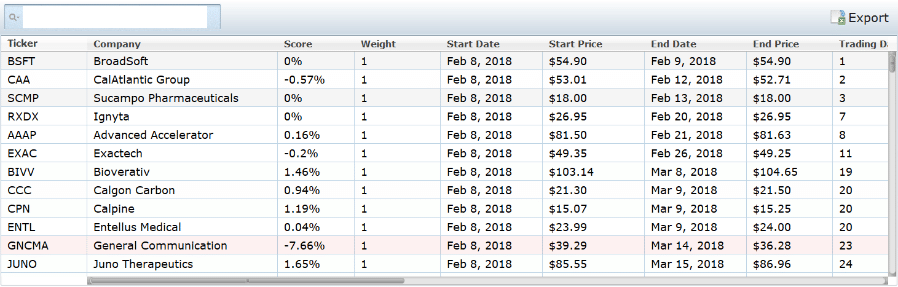
The Backtest Table will display the value of each line in the backtest on any particular date. If your screener includes plotted variables, they will also be listed in the table as separate columns.
Click on the column titles to sort the column from high to low or low to high.
Now Try This
Click on “screener” in the upper left section of the graph to view the annual return and total return of the strategy. You can also see this information in the table in the lower right. You can use this space to remove outliers from the graph of your screen (try clicking multiple times to remove successive outliers), temporarily hide your screen, or change the color of the line. These latter two features can be handy if you plot several variables on the same graph as your screen and would like to hide other lines to clarify other lines.
If you click on the green line for your screener within the graph, you can see a different set of options:
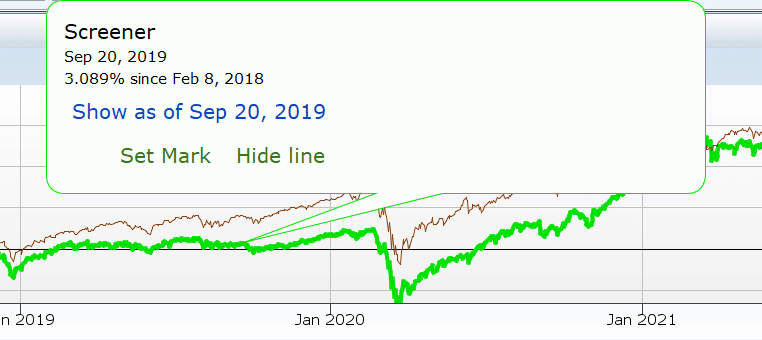
This menu allows you to either set a mark on the current backtest line for reference or to view the Results tab for the screener for that particular date.
If you set a mark on your backtest, the returns of the screener either up to (if you clicked on a date before the mark) or since (if you clicked on a date after the mark) the date of the mark will be shown on the popup window when you click on the line.