
Backtest Features
Open the Good to Great Stock Screener and backtest the strategy

This strategy finds companies with consistent sales growth of 8 to 25% over three years. These winners are then ranked by adding the Income Statement Score and Value Score together. The top five or so stocks that pass these tests are selected.
The Backtest will buy all stocks that pass the strategy on the start date of the backtest. In the case above, that date is Jan 11, 2019
The backtest, by default, rebalances every Tuesday. What does it do when it rebalances?
– When the backtest rebalances, it checks to see whether the stocks that passed since the previous rebalance still pass the strategy. It also checks to see if any new stocks pass the strategy. It sells the stocks that no longer pass and buys the stocks that recently passed the strategy. It also gives equal portfolio weight to each stock in the strategy at each rebalance.
What if you want to change when it rebalances?
Create a Tab Called “rebalance” and specify when or how often you want it to rebalance. (Putting True inside of the tab will make the backtest rebalance daily, and putting False inside the tab will make the backtest never rebalance.)
Let’s change the backtest to a monthly rebalance:


Now re-backtest the strategy:


The green line represents the strategy based on buying and selling the stocks that pass the Good to Great stock screener. (If, at any point, the green line reaches 200, that means your strategy made a 100% return on that date!)
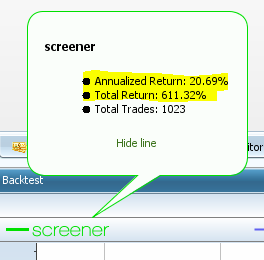
Click on Screener to view the annualized and total returns of the strategy:
How are returns calculated?
– The returns are calculated per stock based on the opening of the day the stock was bought to the opening of the day the stock was sold. Then that return for the particular stock, while it was held in the backtest, is added to the total return of your strategy.
What stocks passed the strategy at a certain point in the backtest?
– Click on any point in the backtest, and you can select “show as of” Month, Day, or Year.

How do I change the dates on the backtest?
There are two ways to change the dates.
– Use the date selector or type the dates in manually.

Scroll upwards on the graph to zoom in on specific dates. You can click on the graph and drag it to move horizontally.
Plot the average of a property of the stocks in the backtest on a particular date.
– Switch to the Tools Tab and drag the property PE to “Show in Results.”

Now Re-Backtest and notice how the average “PE” of the stocks that were in the backtest for any particular date is now plotted on the graph.

Backtest Breakdown

The backtest breakdown shows you the performance of a strategy in each particular year. If you zoom in on the chart, you can view performance on each particular month and day in the past.
In the upper right-hand corner of the graph, there is an option to “show all days,” “show only bullish days,” “show only bearish days,” or “show random days.” Selecting any of those options will allow you to compare the strategy’s performance versus the market on days when the market is only going up or down or any random set of days.
Backtest Table

The Backtest Table as shown above, displays the value of every line in the backtest for every single date in the backtest.
(Click on the column titles to sort from high to low or low to high.)
Click on the Excel Export Icon.


You can export the data of this table and save it for future easy use and access!
Now Try This
Click anywhere on the green screener line on the graph to see the annual return and total return of the strategy at that point in time. (You can also see this information in the table in the lower right.) Click on “Screener” in the upper left hand corner of the graph. You can use this pop-up space to remove outliers from the graph of your screen (try clicking multiple times to remove successive outliers), temporarily hide your screen, or change the color of the line(s). These features can be handy if you plot several variables on the same graph. You can hide different lines to see other data lines more clearly.
