
Value Across Time YRLY – New Featured Screen
The Value Across Time Yearly screen uses our brand new Value Across Time Score in which companies are ranked between 0 – 10 to assess how much continuous value is associated with each company.
If you are interested in learning about the new score, you can read this article.

- The Value Across Time Score must be greater than 7
- The company cannot be classified as a financial services company or a biotechnology firm
- The company cannot be an REIT or a Depositary Receipt or a Limited Partnership
- The rank of Num Times Large Change Where the Value Across Time Score is greater than 7 must be in the bottom 50%
How Does This Strategy Fare over the Past Twenty Years?
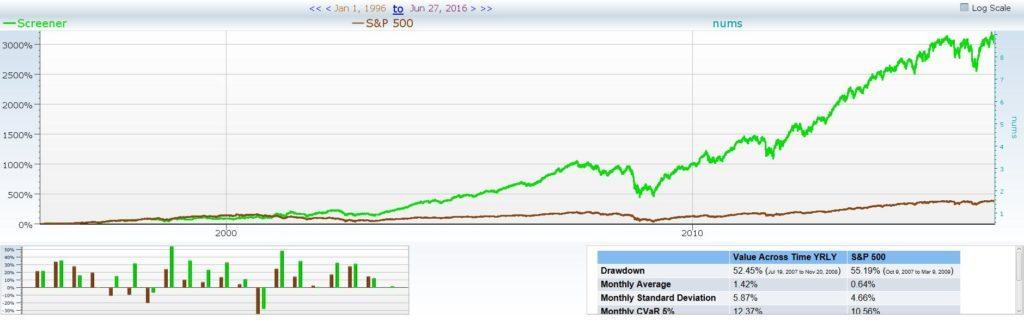
This strategy makes an average of 18.31% annually compared to the S&P 500’s 7.87% annually over the past twenty years. This, though impressive as just a number, is made even more impressive by the fact that this result includes all trading costs over this period for almost 22000 trades. This number, though it seems daunting can be cut down further by you as you analyze each company and find the best fits for your portfolio.
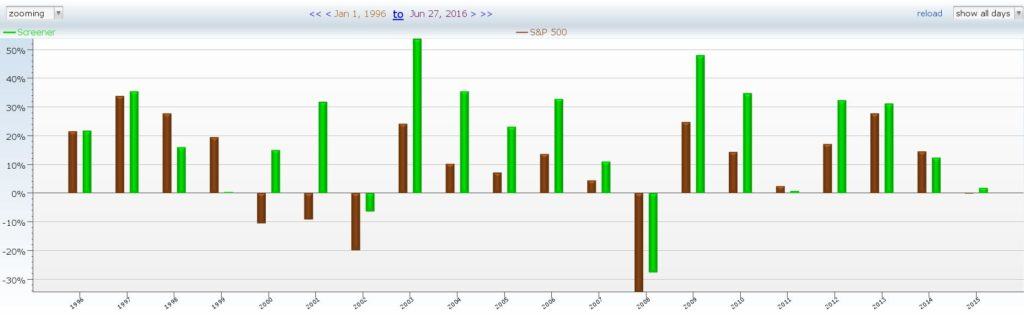
In that time this strategy has consistently outperformed the S&P every year – making more money on up years, and losing less money on down years. When rebalanced on a monthly basis at week 1 this strategy only experiences two down years.

This strategy is fairly diversified across most every industry. However, it does rely a little too heavily on small caps – almost 50% of companies trading in this time period are considered small caps. This, though it may be concerning for people with portfolios that focus on dividends and blue chip stocks is not as big of a deal to younger investors such as myself.
Standardized Validation Suite Passed by the Screener:
- Beat the S&P 500 over the past year
- Held more than 40 stocks in a ten year period
- 60% success rate
- Passed Long term rebalance criteria, but failed short term rebalances
- Backtest is better than, but mirrors similar strategies such as a pool of all dividend stocks
- Screen performs well with different maximum holdings
- Screen does better than the overall market even if you eliminate its best year
- Backtest includes trading costs and succeeds
- Screen does not focus on any one specific industry or company