Research Stock
Using the “Research Stock” function will give you access to the chart of a stock and allow you to test technical strategies on it.
From your account screen, click on enter a company in the box next to Research Stock:
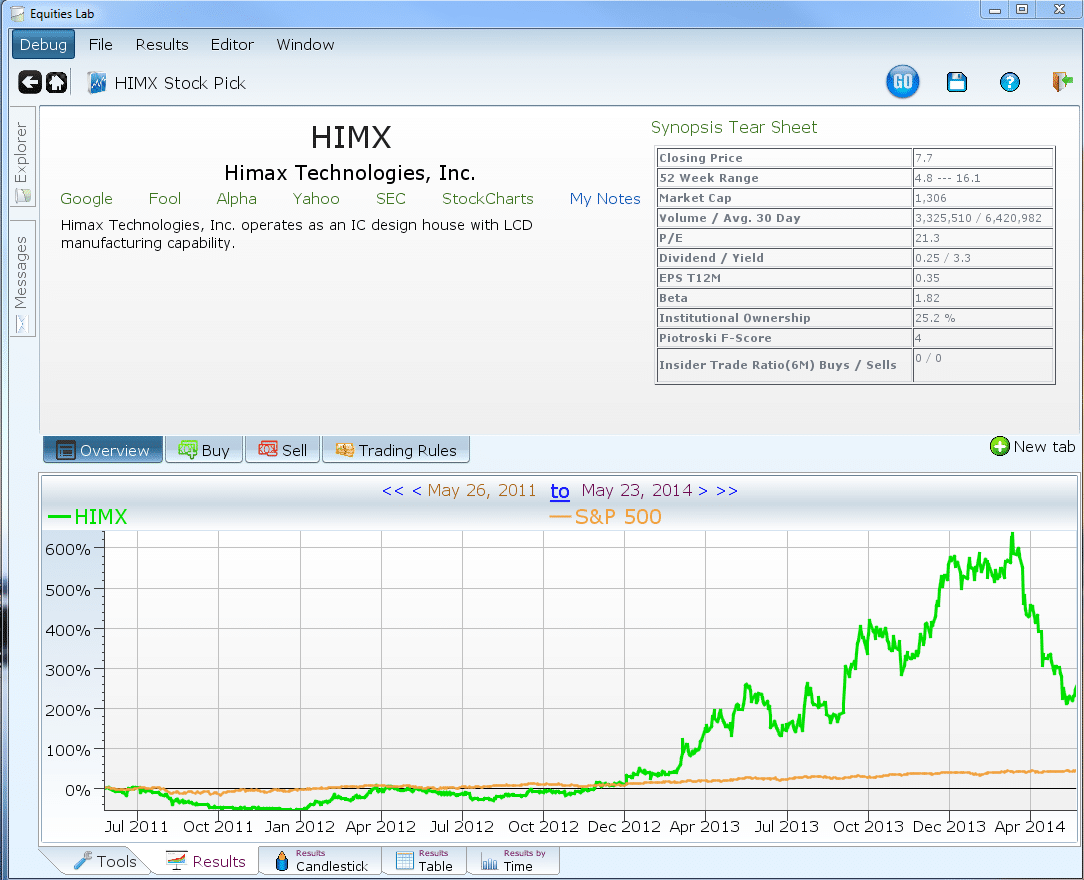
The result of doing so will be a stock chart over the past 3 years alongside the S&P 500. In the overview tab, tear sheets that give useful information about the stock are available. Click on the tear sheet header to switch to another tear sheet.
Now switch to the Trading Rules Tab and click “Buy and Hold Trading Model” to select a different trading model. Choose the Simple Moving Average trading model.
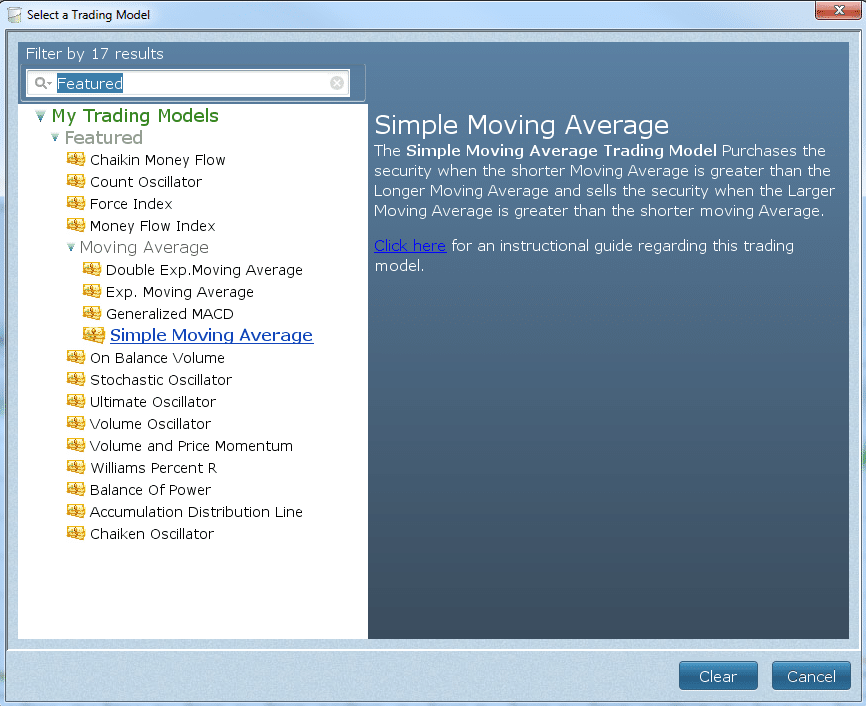
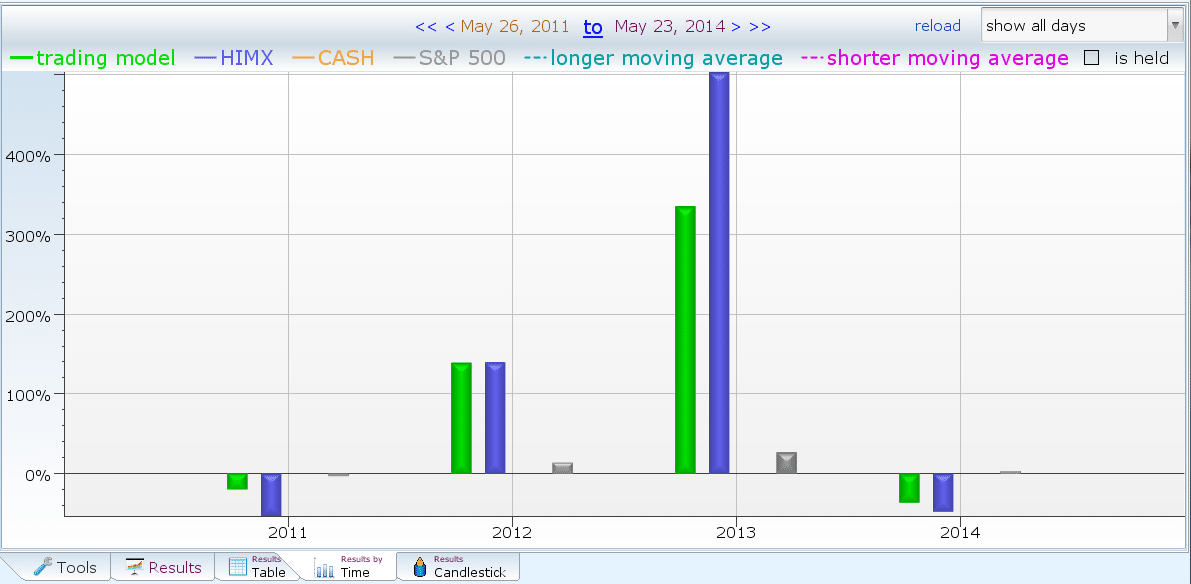
The graph will now show the returns if you have traded your stock using the Simple Moving Average Trading Model. This Trading Model buys when the shorter moving average (12 days) is greater than, the longer moving average (26 days). You can go to the Buy Tab for an actual term used to create the trading model.
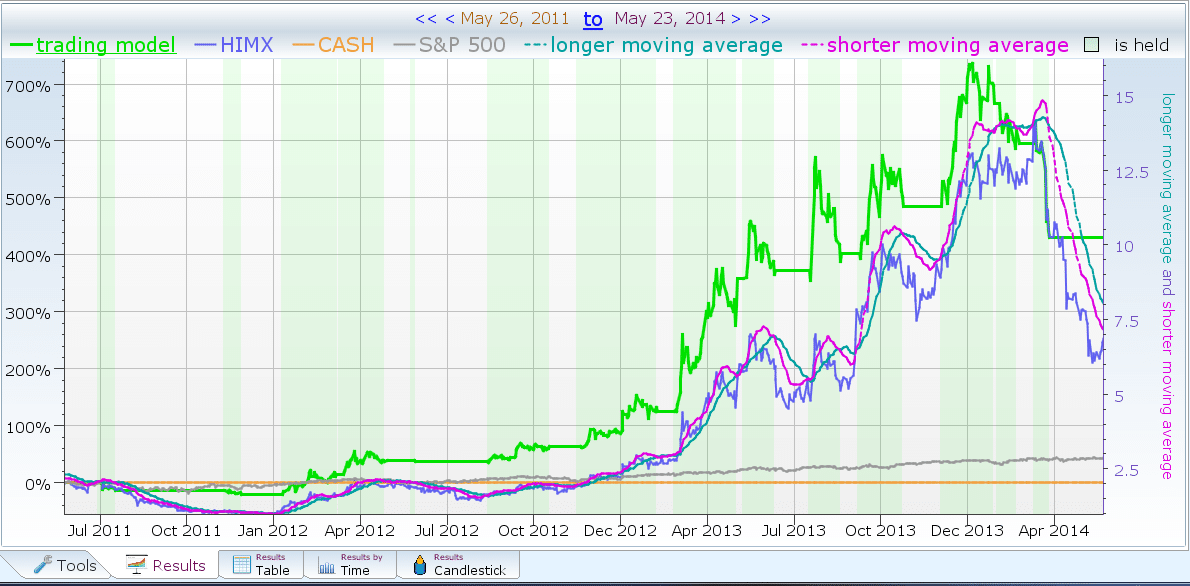
The green line in the graph represents your return if you would have traded the stock based on the simple moving average trading model.
The purple and sky blue lines represent the longer and shorter moving averages. They are displayed because we plotted them in the buy tab.
The green shading represented when the trading model was true, and the stock was being held.
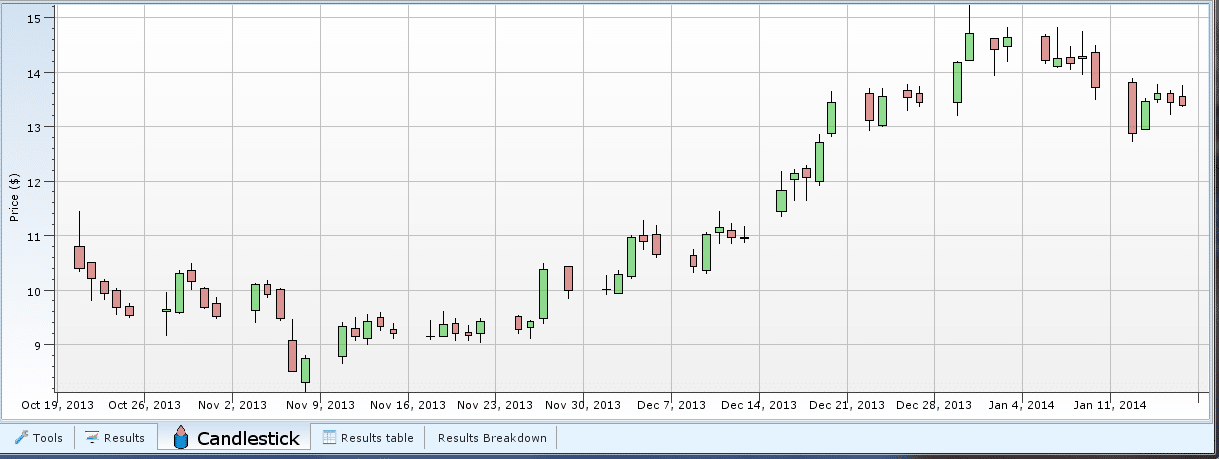
Now At the bottom of the program, click on the candlestick tab to view the stock’s candlestick chart.
Wow, click on Results By Time to see a performance breakdown by years, months, etc.