
Find Stocks
Find Stocks to Buy
From your home page, click on “Open Explorer,” or the “Explorer” tab on the left. You will see a list of stock screens, watchlists, and a search bar to filter through them. You can select one of the pre-existing watchlists, or create your own from a stock screener.
Follow one of the market-beating screeners
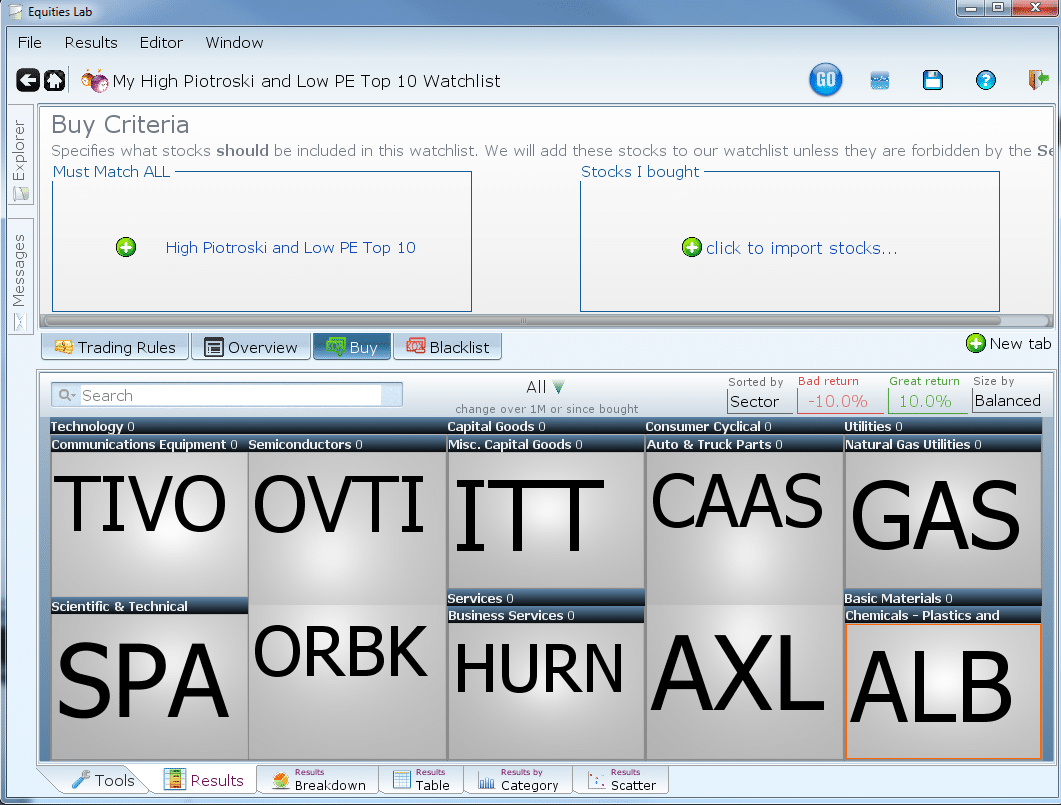
Select the screener you like the best. We choose “High Piotroski and Low PE.” Click on the watchlist icon in the upper right to creat a new watchlist.
- If you like this screener: (Try back testing using the back test icon in the upper right)
- save it then you will get a wall of buy suggestions.
- Otherwise
- click the home button and select another watchlist.
After you save the watchlist, It will be in your account as “My High Piotroski and Low PE” You can locate it in the Explorer Tab.
Try This
Save the watchlist and click on one of the securities and notice there are two options.
- Never Buy <Ticker>
- I Bought <Ticker>
If this was a real trading situation, you would research each company and do one of two things:
- If you don’t like the company then you will select Never Buy. We will blacklist the security so that you will never be told to buy it again. You will be able to unblacklist it at any point.
- If you like the company, after you actually buy it, select I Bought. We will then track the security and tell you when it’s time to sell. It will be time to sell when the security no longer passes the buy criteria which is now the “High Piotroski and Low PE” stock screener.
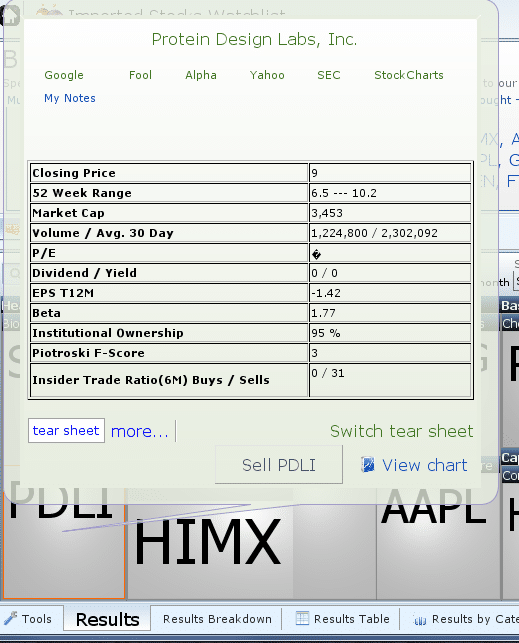
Tear Sheets
Click on a stock in the heat map and notice the information displayed in the “tear sheet”
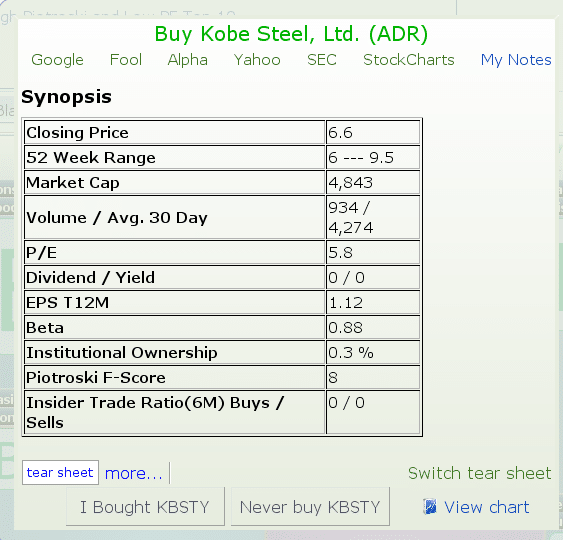
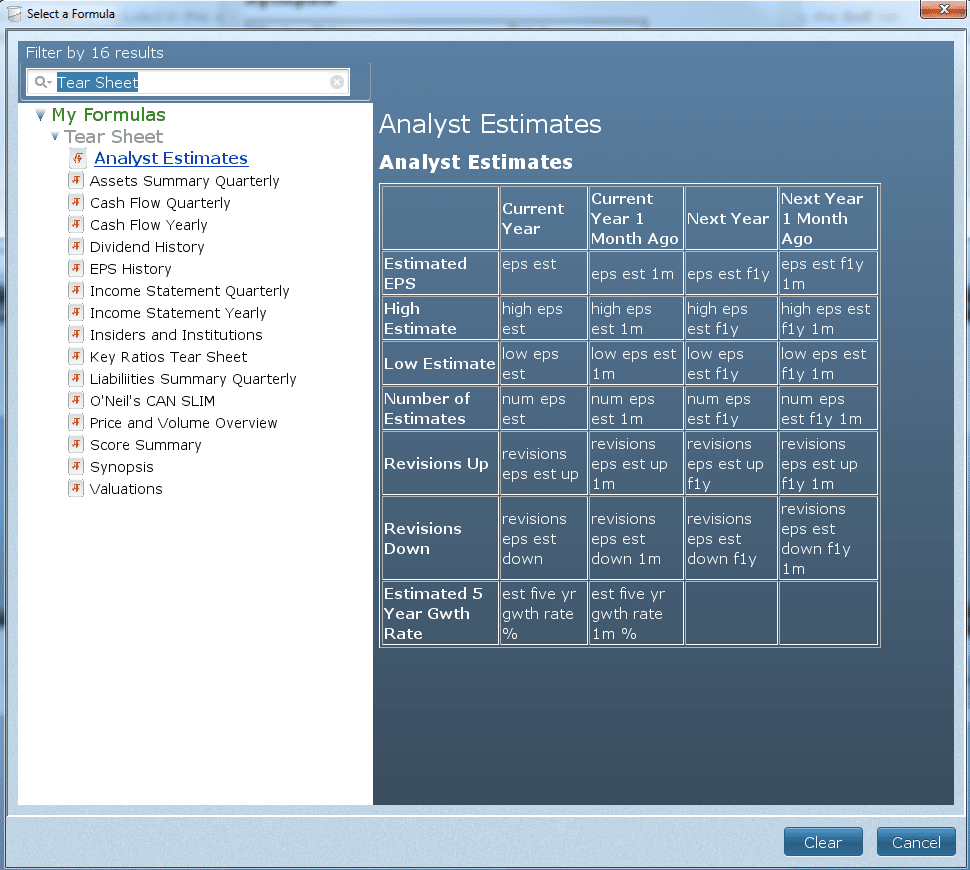
By default the tear sheet will be “Synopsis”. Click on “Switch tear sheet” in the bottom right of the pop-up to get a different set of information.
The resulting window will look like the one below
Viewing multiple tear sheets will help guide you to a decision on whether you think the stock will be a good long or short investment.
Try this
Assume you like about half of the securities so you buy them then blacklist the others.
Switch over to the Blacklist Tab and notice all of the securities you Blacklisted are now displayed here.
Save the Watchlist and return to your Home Page.
.
Importing Stocks
“Import Stocks” will guide you through creating a watchlist of user input stocks to find out information on the stocks indivivually and as a whole.
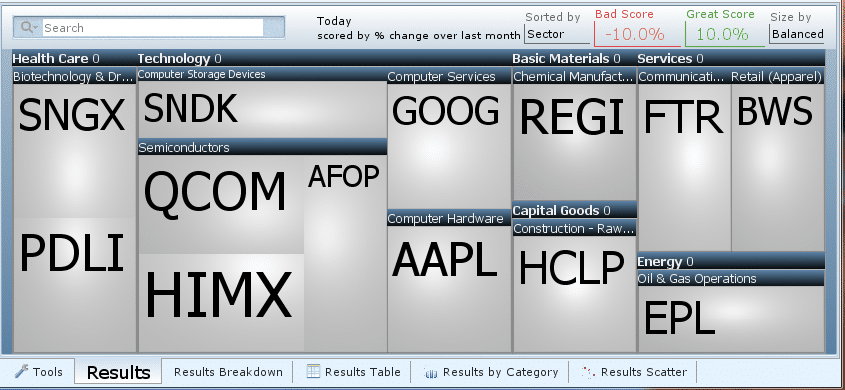
In a new watchilst, click on the “Click to import stocks” button on the right.
In the resulting window type in about 10-15 stocks that you own or are thinking about owning, after pressing DONE the heat map will dsplay all of the stocks you entered
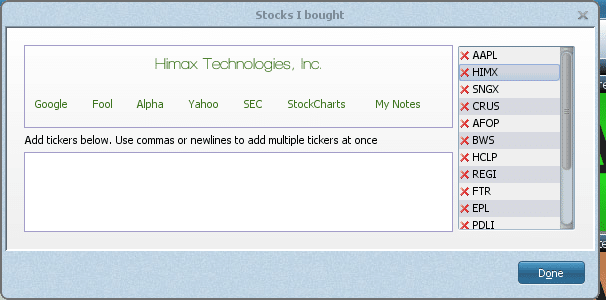
After pressing DONE the heat map will dsplay all of the stocks you entered
Tear Sheets
Click on a stock in the heat map and notice the information displayed in the “tear sheet”
By default the tear sheet will be “Synopsis”. Click on “Switch tear sheet” in the bottom right of the pop-up to get a different set of information.
Check for Rotten Tomatoes
After reviewing your stocks with tear sheets, Blacklist some screeners to make sure none of your stocks pass them.
Switch to the Blacklist Tab and click on “click to blacklist screener”.
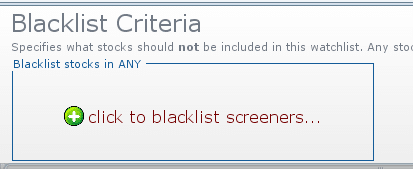
In the resulting window search “yellow flag” in the search bar and choose some of the yellow flag screeners.
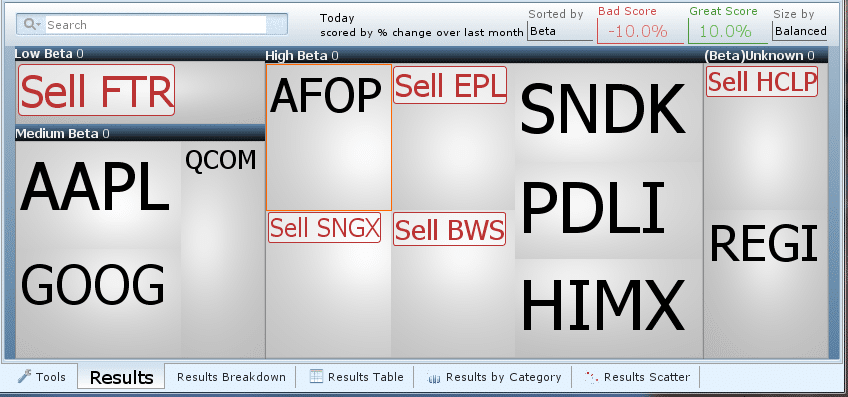
After pressing done, If any of your stocks pass the red flag stock screeners then they will show up on your heat map with a sell suggestion.
In my heatmap SNGX BWS HCLP EPL and FTR pass one or both of the Blacklisted screeners so they show up with a sell suggestion.
Results Breakdown
Now lets find out more information on the group of stocks that are in this watchlist
Switch over to the Results Breakdown Tab at the bottom of the program
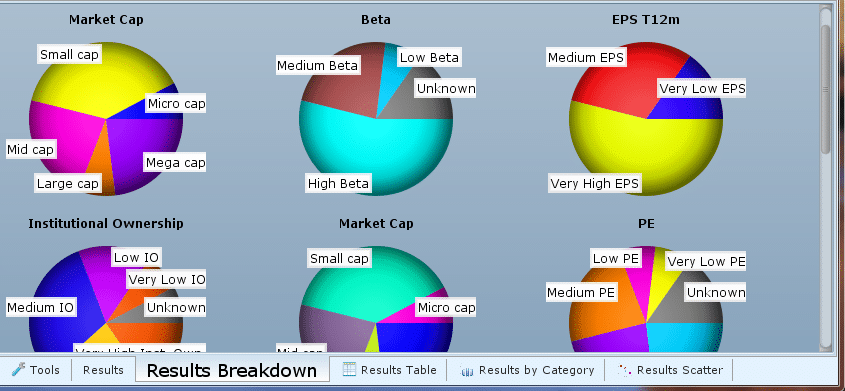
The pie charts displayed are fields from the Synopsis tear sheet described in the section above.
The size of each section in a pie chart relates to how many stocks are in that section.
From my results breakdown it looks like most of the stocks I entered have high betas.
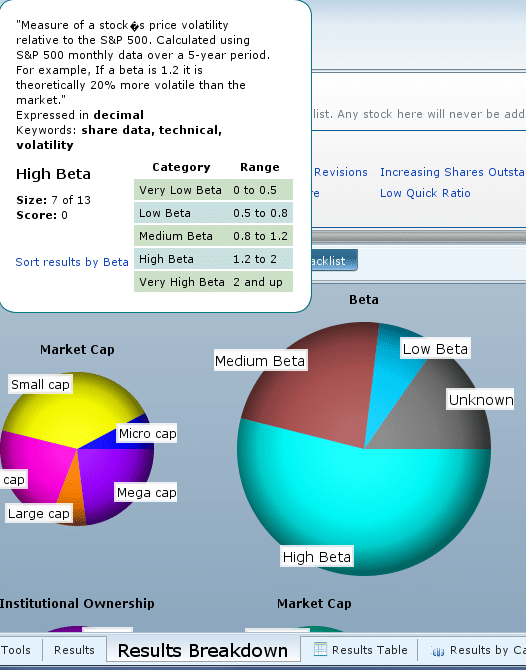
Click on the Beta pie chart to find out what the ranges are for each section then click on “Sort results by Beta” at the top of the pop-up
The heat map containing all of the stocks you entered will now be sorted by PE like you see below: