
Getting Started
From your home page, click on the Explorer tab on the left. You will see a list of stock screeners, formulas, watchlists, and a search bar.
Follow a Market-beating Screener
Select a stock screener you think will do well. We chose the “High Piotroski and Low PE” screener. Click on the watchlist icon in the upper right to create a new watchlist. Below you can see the watchlist we created using the “High Piotroski and Low PE” screener.
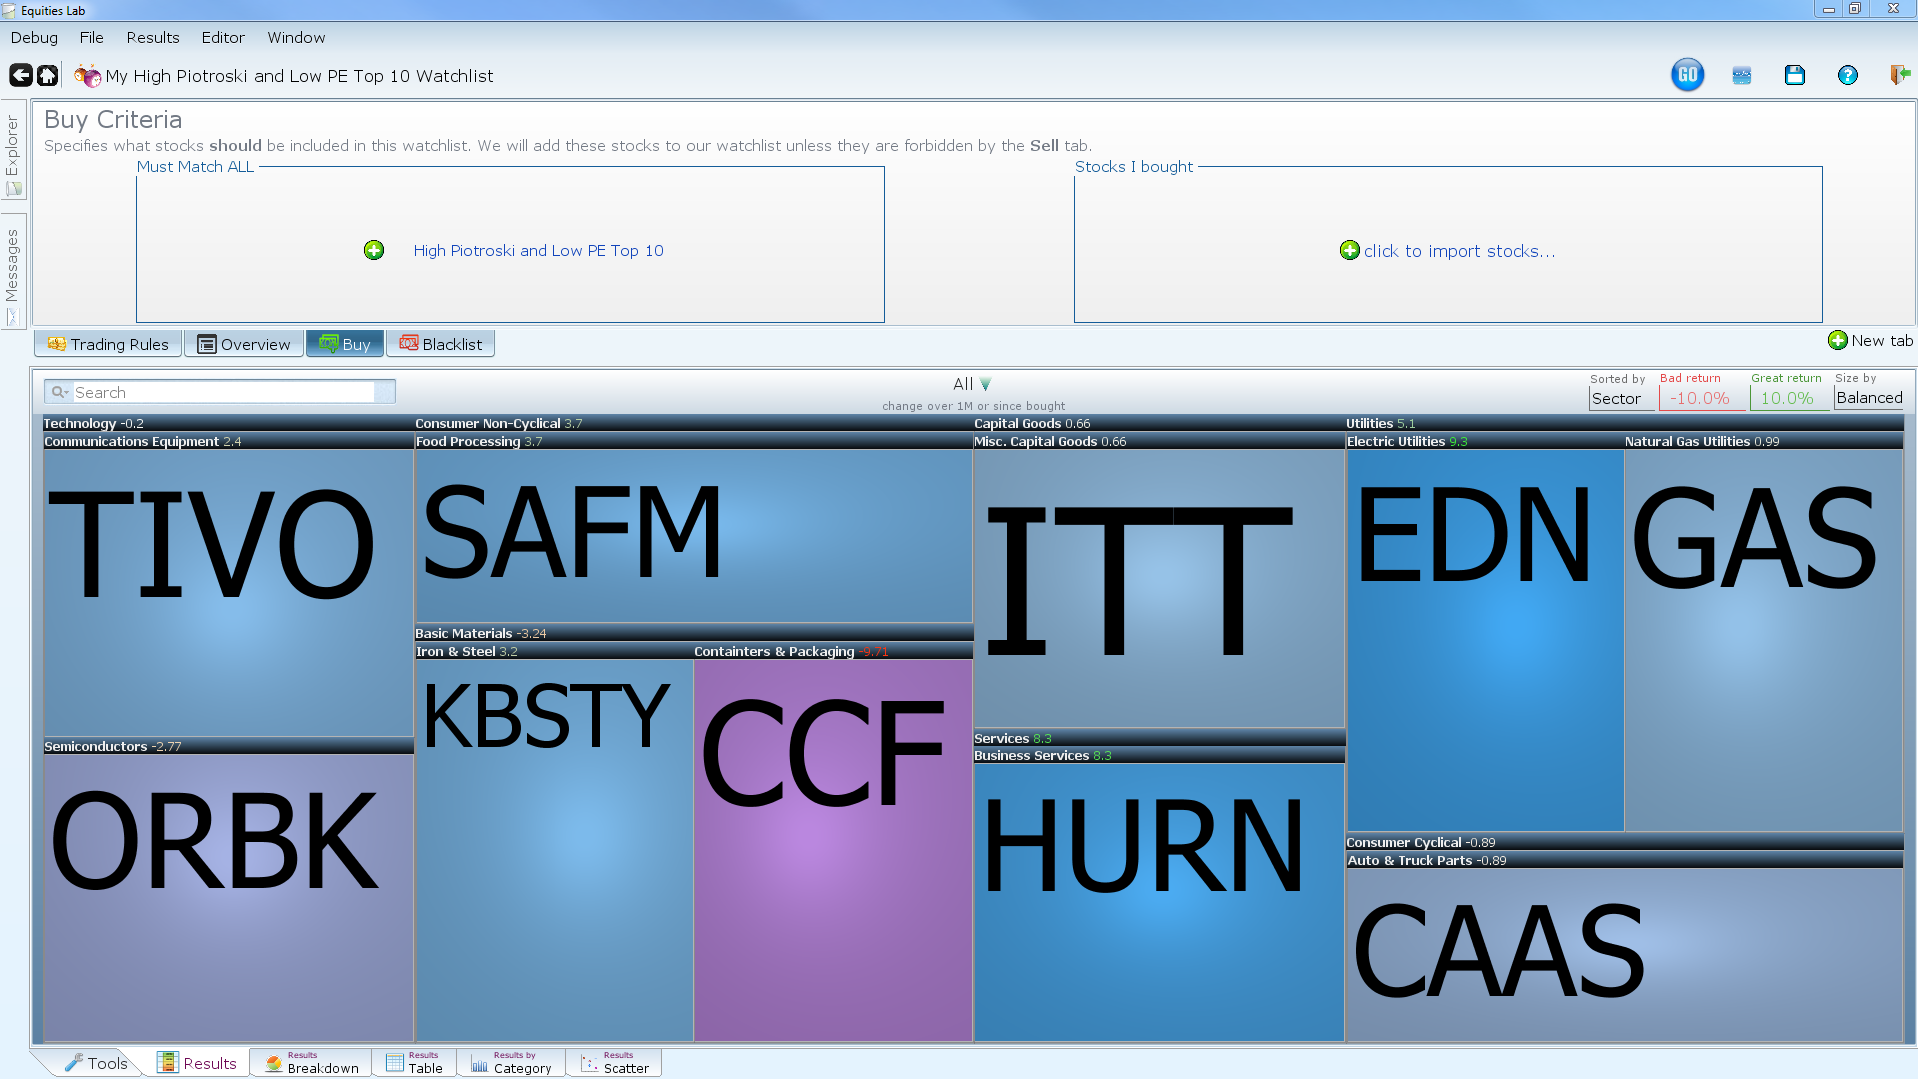
Try backtesting the screener by clicking the back test icon in the upper right. After backtesting, you can save it and you’ll be given a page of buy suggestions based on your chosen screener. (If you want to choose a different screener, open the Explorer tab again to select another.)
If you saved this watchlist, it would show in your account as “My High Piotroski and Low PE” You can locate it in the Explorer Tab.
Try This
Save the watchlist and click on one of the securities and notice there are two options.
- Never Buy “Ticker”
- I Bought “Ticker”
If this were a real trading situation, you would research each company and do one of the following:
- If you didn’t like the company, you can select “Never Buy”. We will blacklist the security(stock) and you will never be told to buy it again. (You can un-blacklist securities at any point.)
- If you like the company and bought it (in the real world), you can select “I Bought”. We will then track the security and tell you when, or if, it’s time to sell. You will be prompted to sell when the security no longer passes the buy criteria (in this case the “High Piotroski and Low PE” stock screener.)
Tear Sheets
Click on a stock in the colorful heat map and notice the information displayed in the “tear sheet”
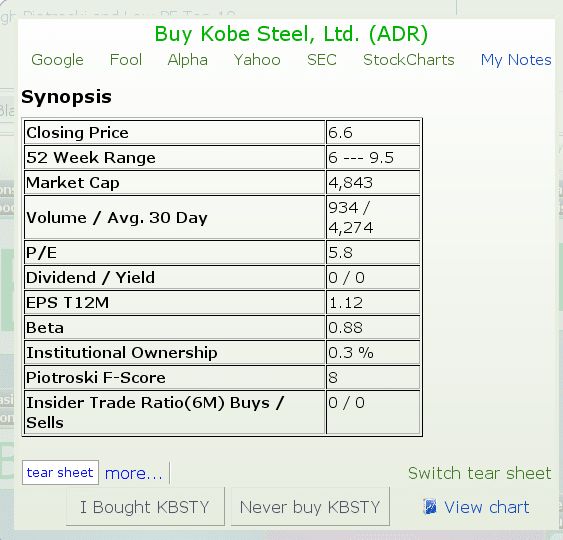
By default the tear sheet will be “Synopsis”. Click on “Switch tear sheet” in the bottom of the pop-up to get a list of other tear sheets.
The resulting window will look like the one below. You can switch the tear sheets as often as you like to find the information you are looking for.
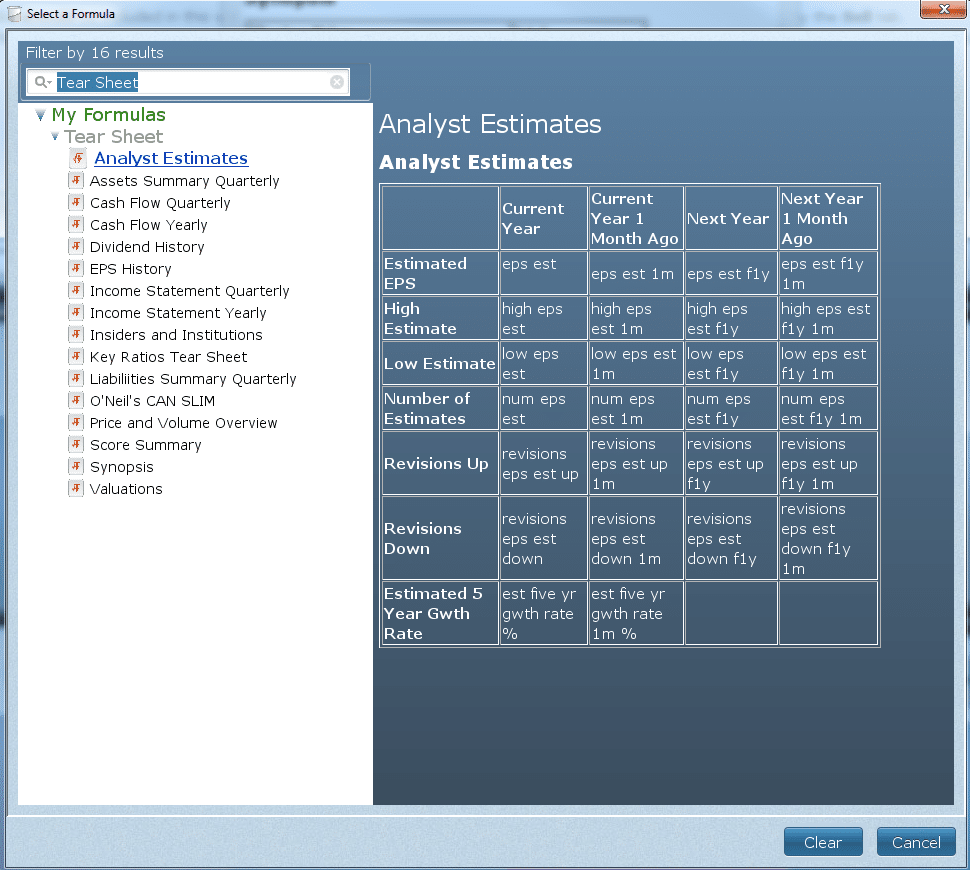
Viewing multiple tear sheets can help guide you to a decision on whether you think the stock will be a good investment, whether it be long or short term.
Try this
Assume you like about half of the securities. You buy the ones you like and blacklist the others.
Blacklisted Stocks
Switch over to the Blacklist Tab. You’ll see that all of the securities you Blacklisted are displayed here.
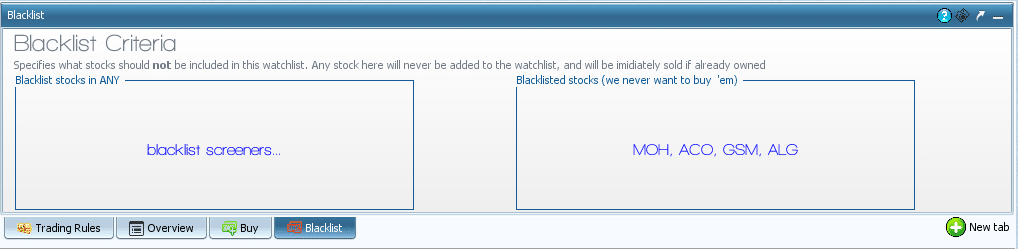
If you like the results of this watchlist and want to use it in the future, save it before returning to the Home Page.
.
Importing Stocks
“Import Stocks“ will guide you through creating a watchlist of user input stocks to find out information on the stocks individually and as a whole.
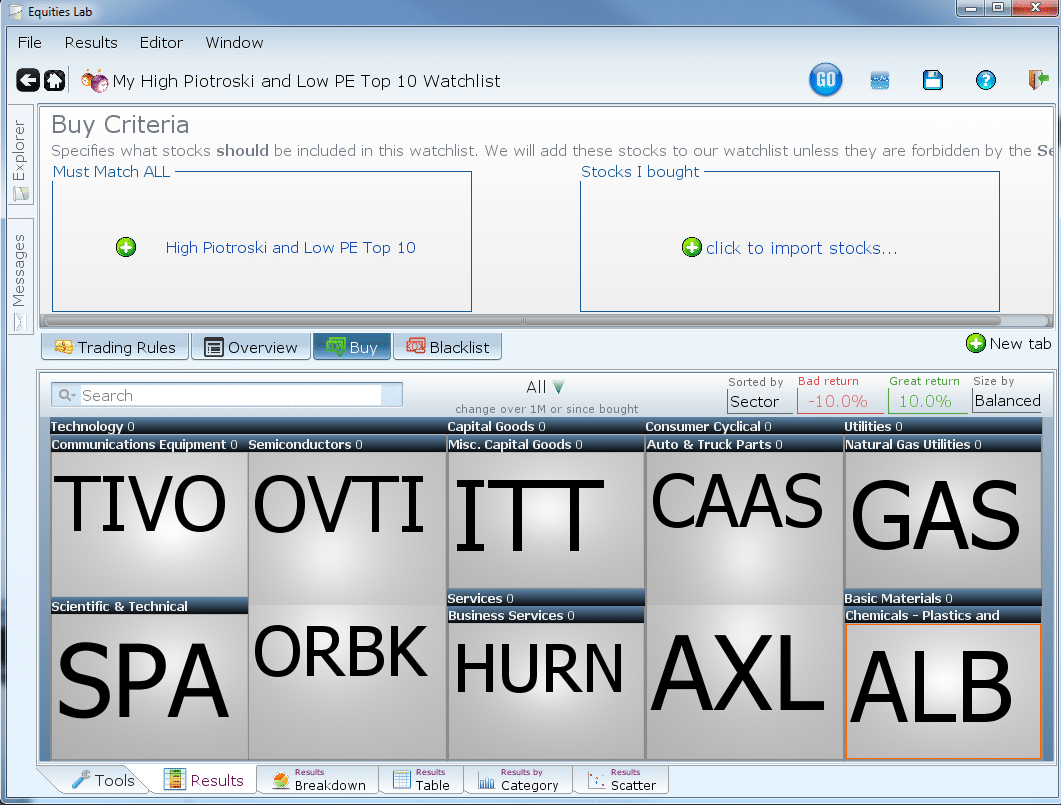
Open a new watchlist and open the “Buy” tab. Click on the “Click to add stocks” button on the right.
In the resulting window type in approximately 10-15 stocks that you own or are thinking of buying. After pressing DONE the heat map will display the stocks you entered, with “Buy” or “Sell” suggestions based on the requirements of the stock screener you chose. (If you enter stocks into this box, they will always be bought whether they match the screener or not.)
Check for Rotten Tomatoes
After reviewing your stocks with tear sheets, try Blacklisting some screeners to make sure none of your stocks/securities pass them.
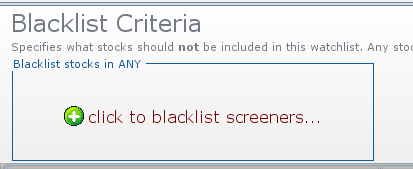
Switch to the Blacklist Tab and click on “click to blacklist screener”.
In the resulting window type “yellow flag” in the search bar and choose some of the yellow flag screeners.
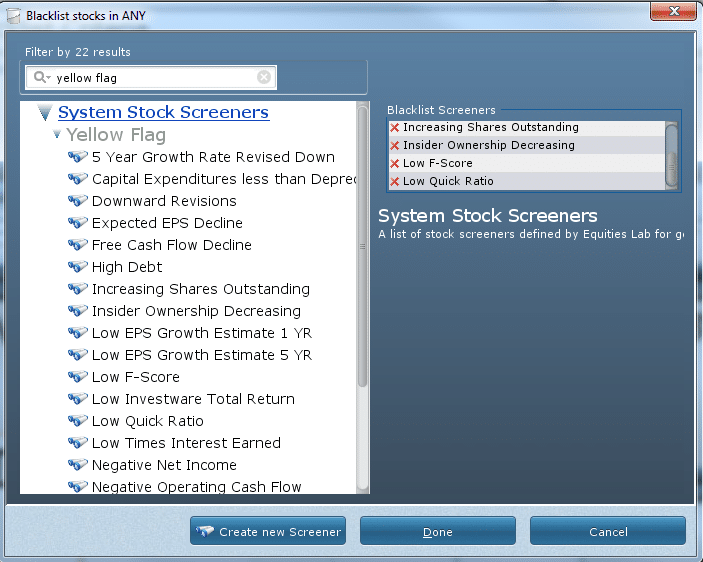
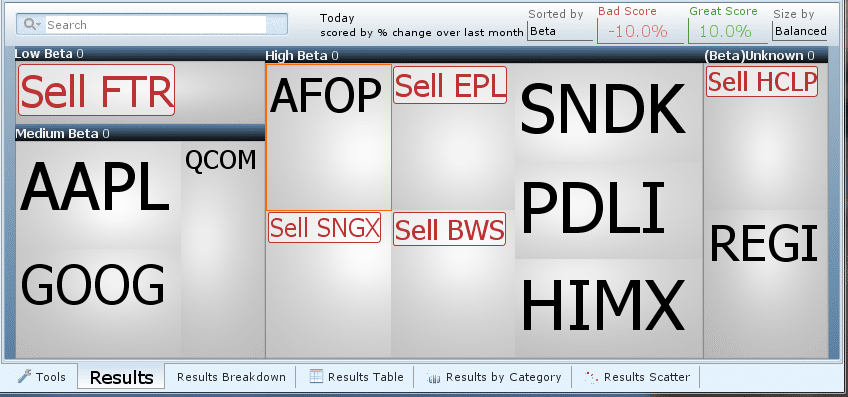
After pressing done, if any of your stocks pass the red or yellow flag stock screeners then they will show up on your heat map with a “Sell” suggestion.
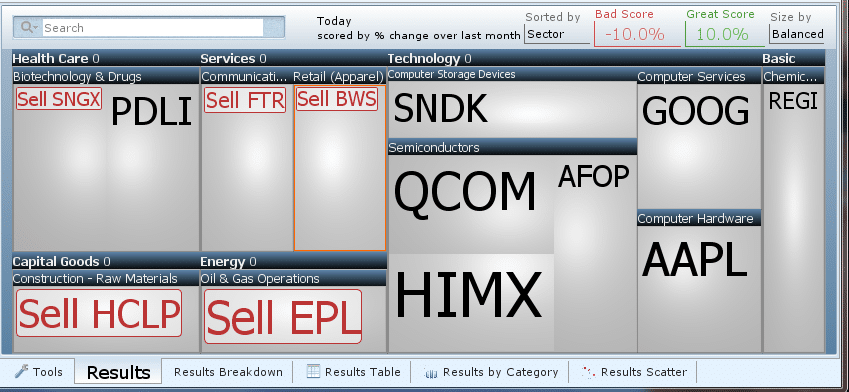
In the heatmap above SNGX, BWS, HCLP, EPL and FTR pass one or both of the Blacklisted screeners, so they show up with a “Sell” suggestion.
Results Breakdown
Now lets find out more information on the group of stocks that are in this watchlist
Switch over to the Results Breakdown Tab at the bottom of the page.
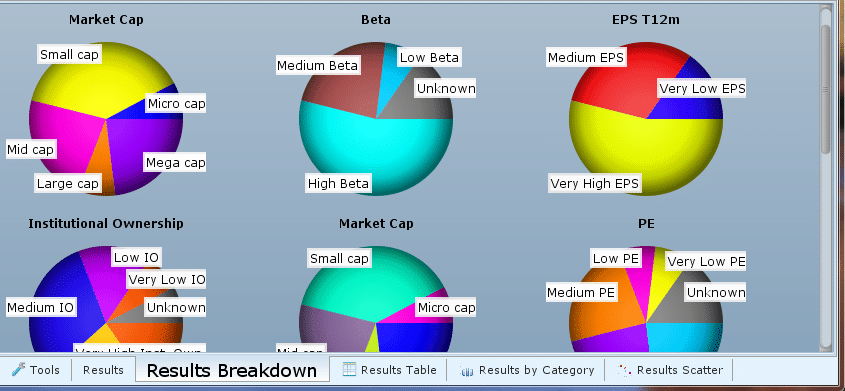
The pie charts displayed above visually show fields from the “Synopsis” tear sheet (described in the section above).
The size of each section in a pie chart relates to how many stocks are in that section.
From my results breakdown it looks like most of the stocks we entered have high betas.
Click on the “Beta pie chart” to find out what the ranges are for each section. Click on “Sort results by Beta” at the top of the pop-up.
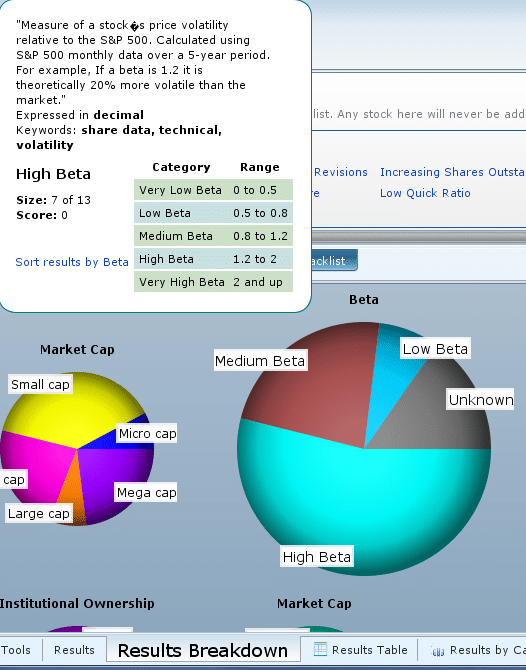
The heat map containing all of the stocks you entered will now be sorted by PE like you see below: