
Overview
Crafting Strategies
Backtesting
UI Features
Common Models
Learning about Green Flags and the Green Flag Score
Updated: 5.3.2024
Green Flags
We have reviewed red flags, so let’s look at the other side of the equation; green flags.
Recap
Previously, we discussed that red flags don’t necessarily mean an investment will lose money. Green Flags are the opposite of red flags, but like red flags, they do not guarantee anything. A company could have every green flag raised and still lose money over the time you hold it. However, green flags indicate that a company is less likely to be a dud and increase your chances of long-term success.
Where to Find Green Flags
To see a list of green flags, you can go into the Explorer tab and search “Green Flags Score.”
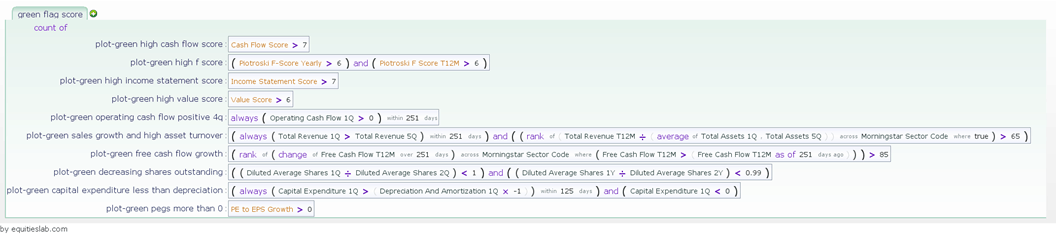
There are ten total green flags, all tested. When testing, we want to ensure that more than 50% of the positions taken on by each green flag result in a positive return. When backtested, the screen performs up and to the right, at least moderately close to the benchmarked S&P 500. If you want, you can see Atlantic Flag and Pole website to get the flags they choose, as there are many varieties.
How effective is the green flag score?
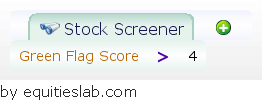
Like everything else we do here at Equities lab, rather than write out how something performs, we would rather show you. To identify how well Green Flags work, we can create a screener where we only invest in companies with a score of greater than 4. There are several names we would recognize in this batch but even more that we would have never known about otherwise.
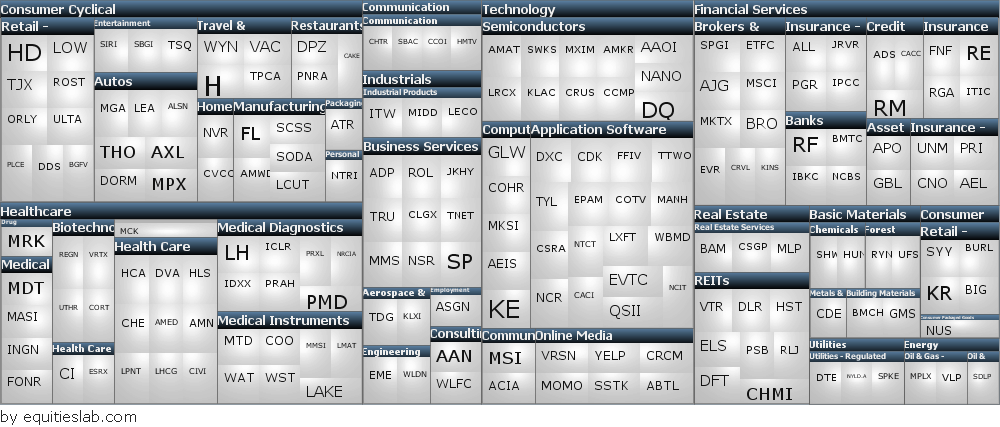
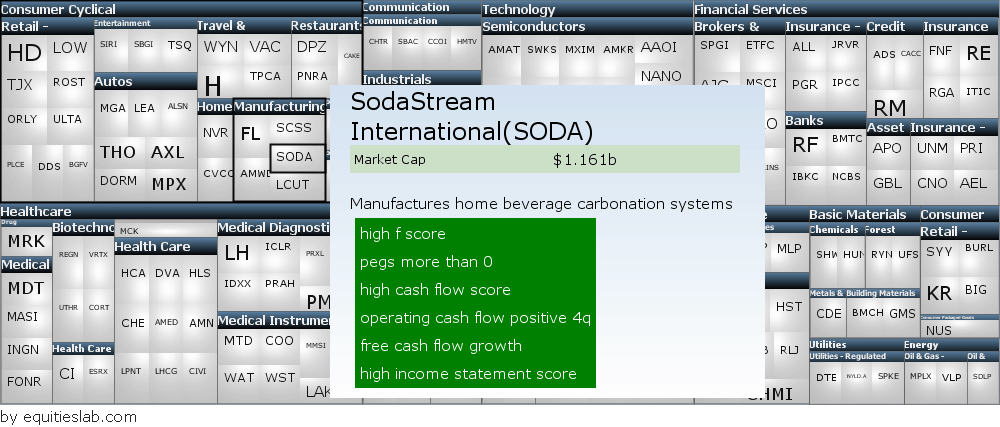
Now, some of these companies have more green flags than 4, and it’s up to you to decide how many green flags you’d like your screener to look for. The same functionality that is used for our red flag indicators is used for our green flags, so you can see exactly how many green flags are present and what they are simply by hovering over the ticker.
This is all fine and well, but showing the different flags is completely meaningless if they don’t actually beat the market over the past 20 years.
The Results
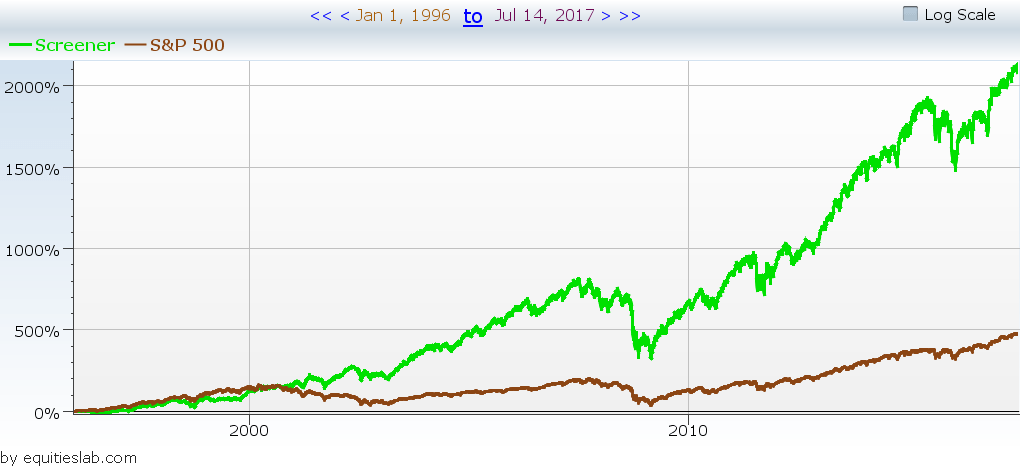
Thankfully they do. When screening for companies with a green flag score of greater than 4, we can absolutely crush the S&P 500. Better yet, we achieved these results at a relatively low standard deviation – putting our Sharpe ratio at 0.227 vs. the S&P 500’s 0.149.
If we return to our initial requirements for “what makes up a green flag,” these results must follow certain rules. By that standard, 51% of companies inside of a green flag need to have given us positive returns, but when we dive into the positions table of our screen here, we notice that there is an almost 60% win rate for this screener.
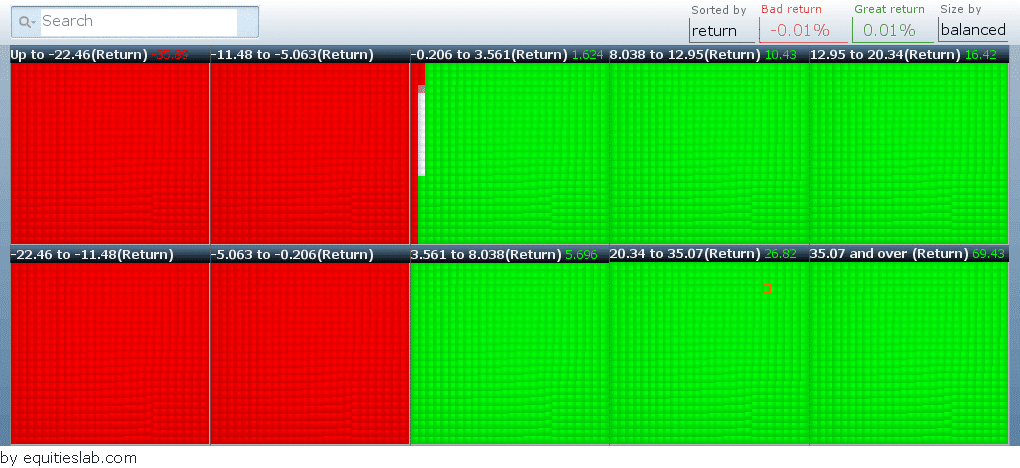
Takeaways
The most important thing about the graphic above is that you don’t always win. How many green flags appear when you open a position doesn’t matter. There is always a chance that you are going to lose. The best thing you can do is increase your chances of success and invest as intelligently as possible.