
Overview
Crafting Strategies
Backtesting
UI Features
Common Models
How To Use Monte Carlo With The Piotroski Score
Analyzing a factor without ranking
The following article will be a step-by-step walkthrough of “How to analyze a factor without ranking in Equities Lab.” It will enhance your knowledge of the features within Equities Lab, while giving you insight to the power that can come from utilizing the software appropriately.
First thing you need to do is create a stock screener.
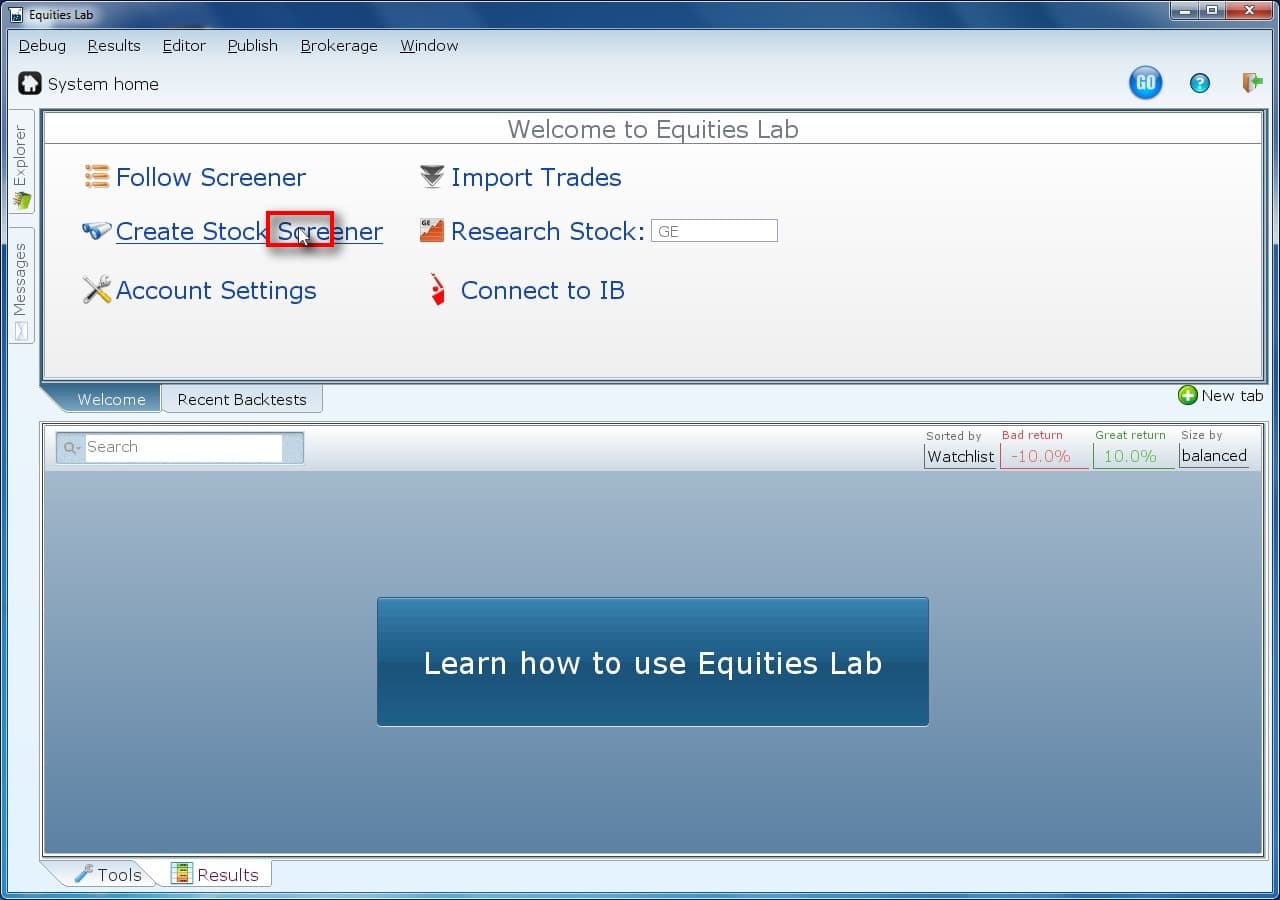
Everything starts with creating a screener. So, onward!
Name your screener, mine will be named “Piotroski Homework Walkthrough.”
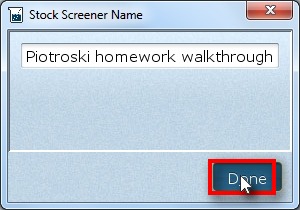
If you create a screener with a namee, then it can be found later. If you want to put your screeners into categories, simply put MyCoolCategory: at the front, and it can be found there.
Limit your stocks by putting in Market Cap.
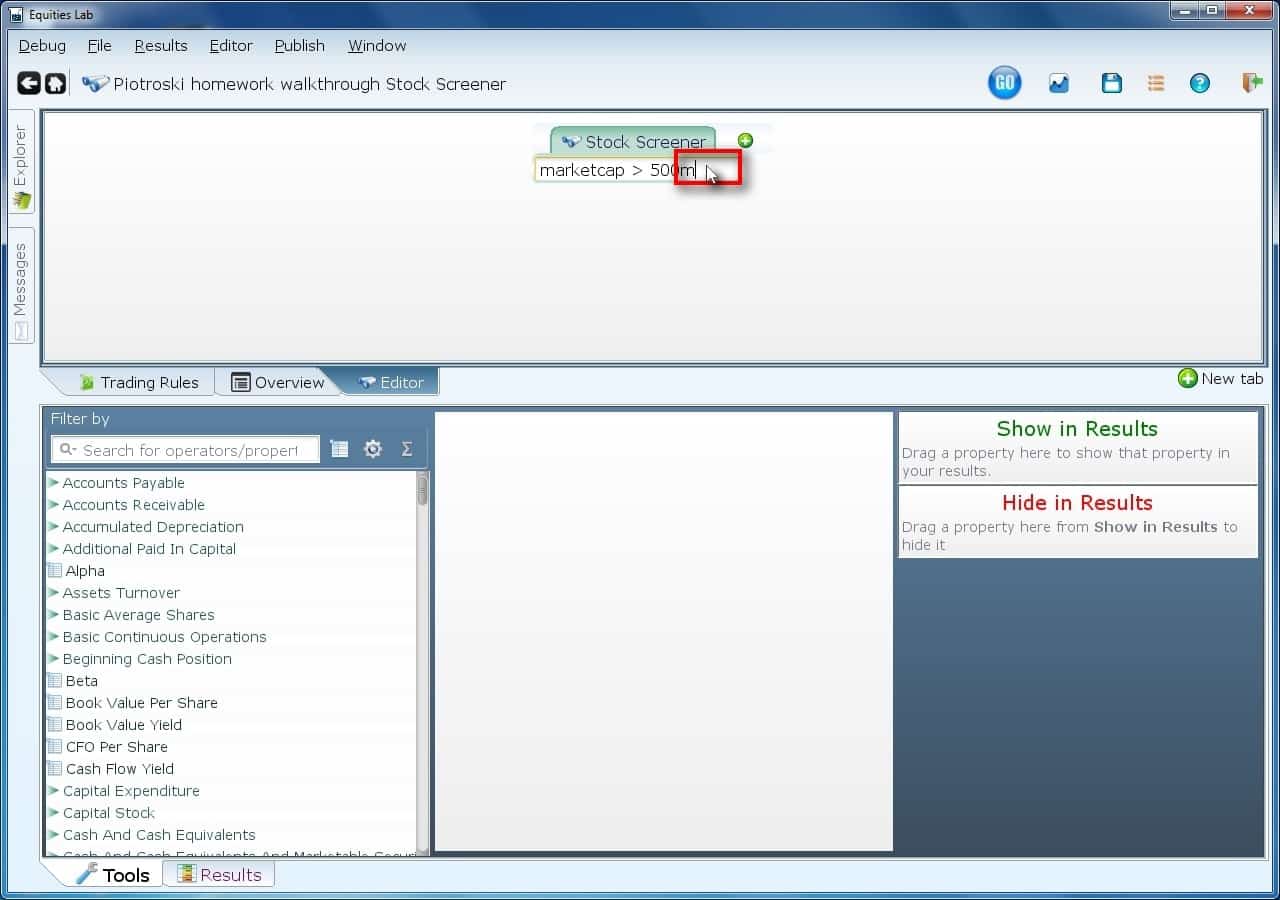
You can type “Market Cap > 500m” here. You could alternatively type “mc > 500m”, keying on the capital letters. Or you could type “>”, hit return and fill in both boxes, one with MarketCap and the other with 500m. Of course your assignment has you using a different cutoff, but that’s your problem 🙂
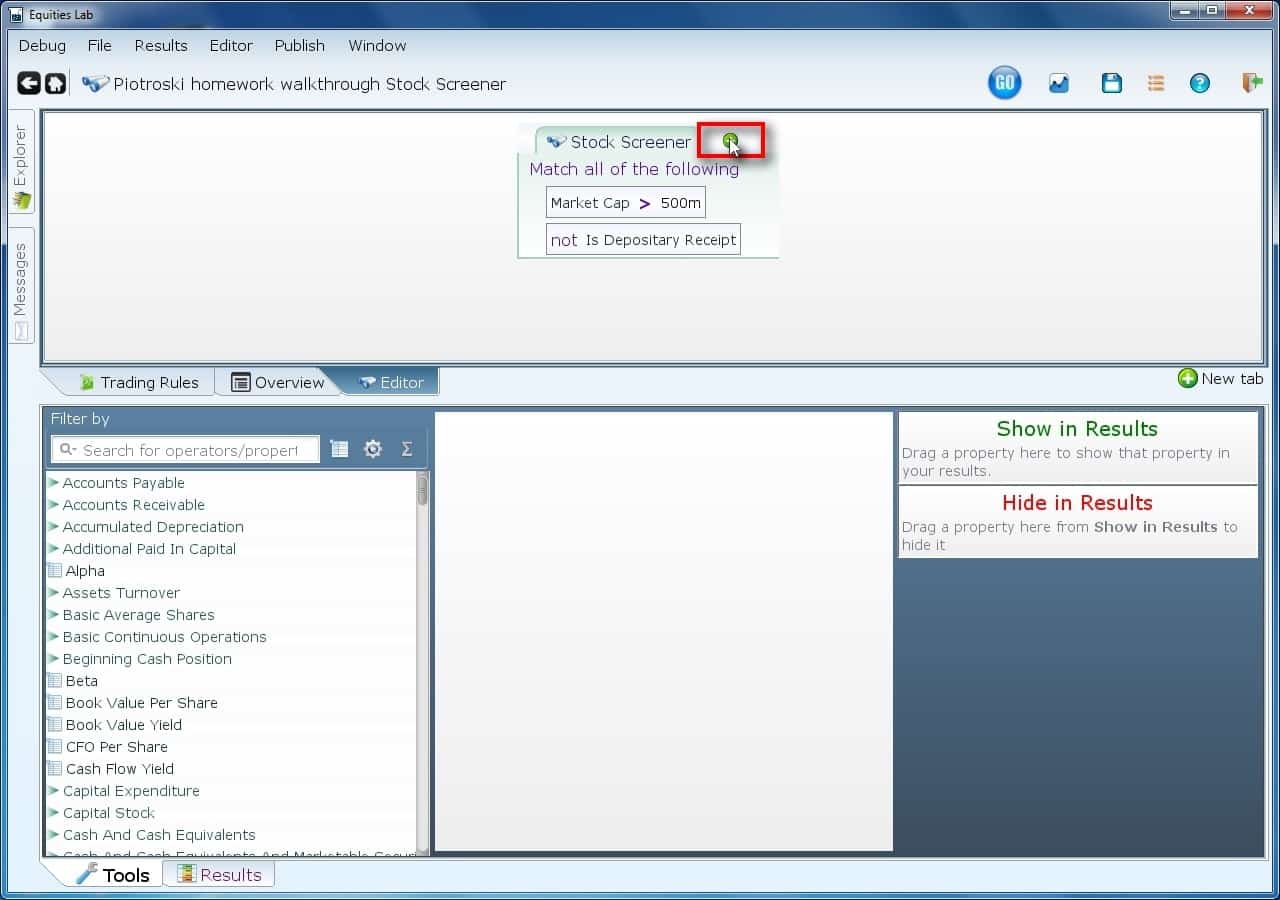
Add a new line.
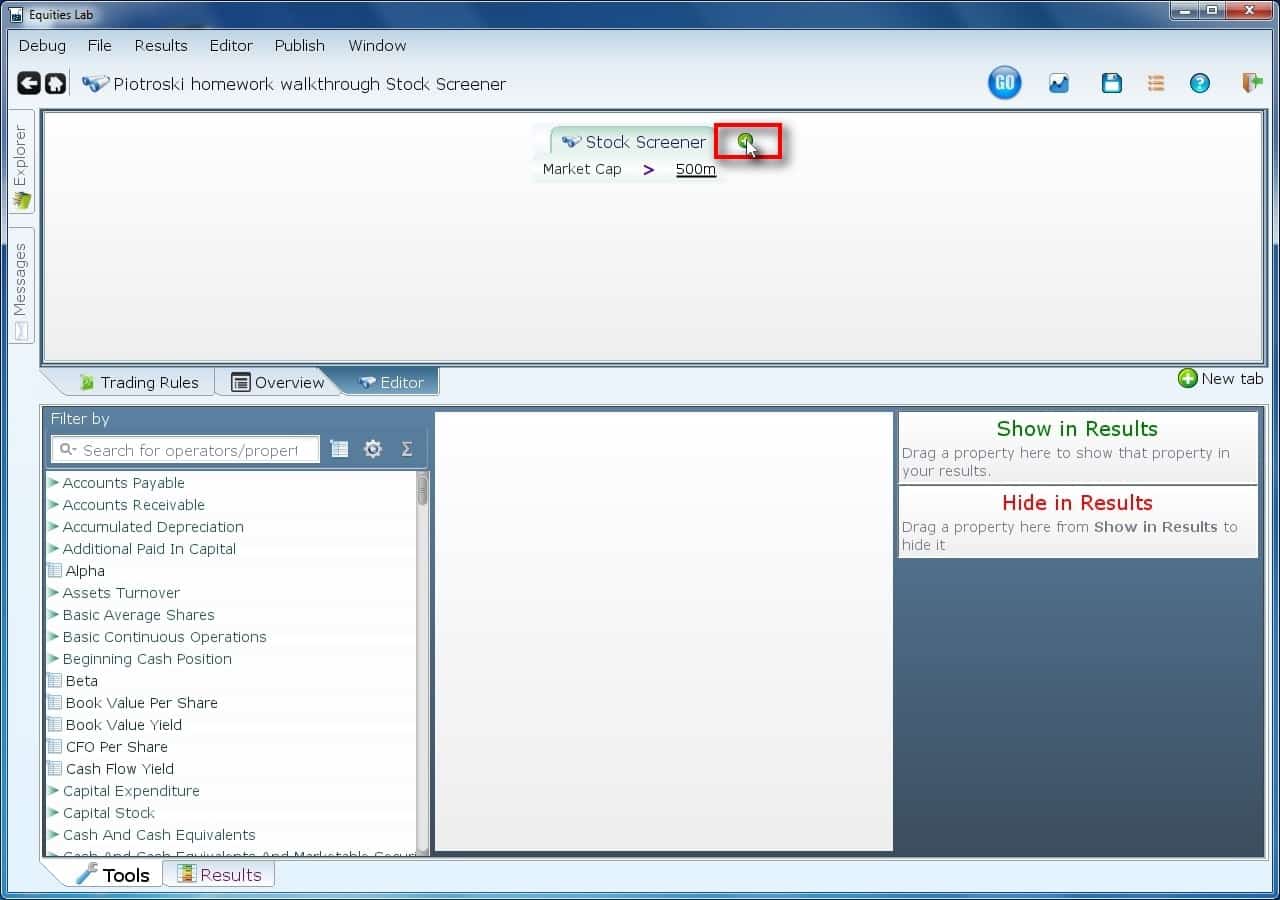
You can add lines by doing any of the following:
1. Clicking on that green plus.
2. Typing a semicolon.
3. Select the “>”, type “and” and hit return. This actually wraps whatever condition you type with an AND, but that gets the job done.
Get rid of foreign ADRs
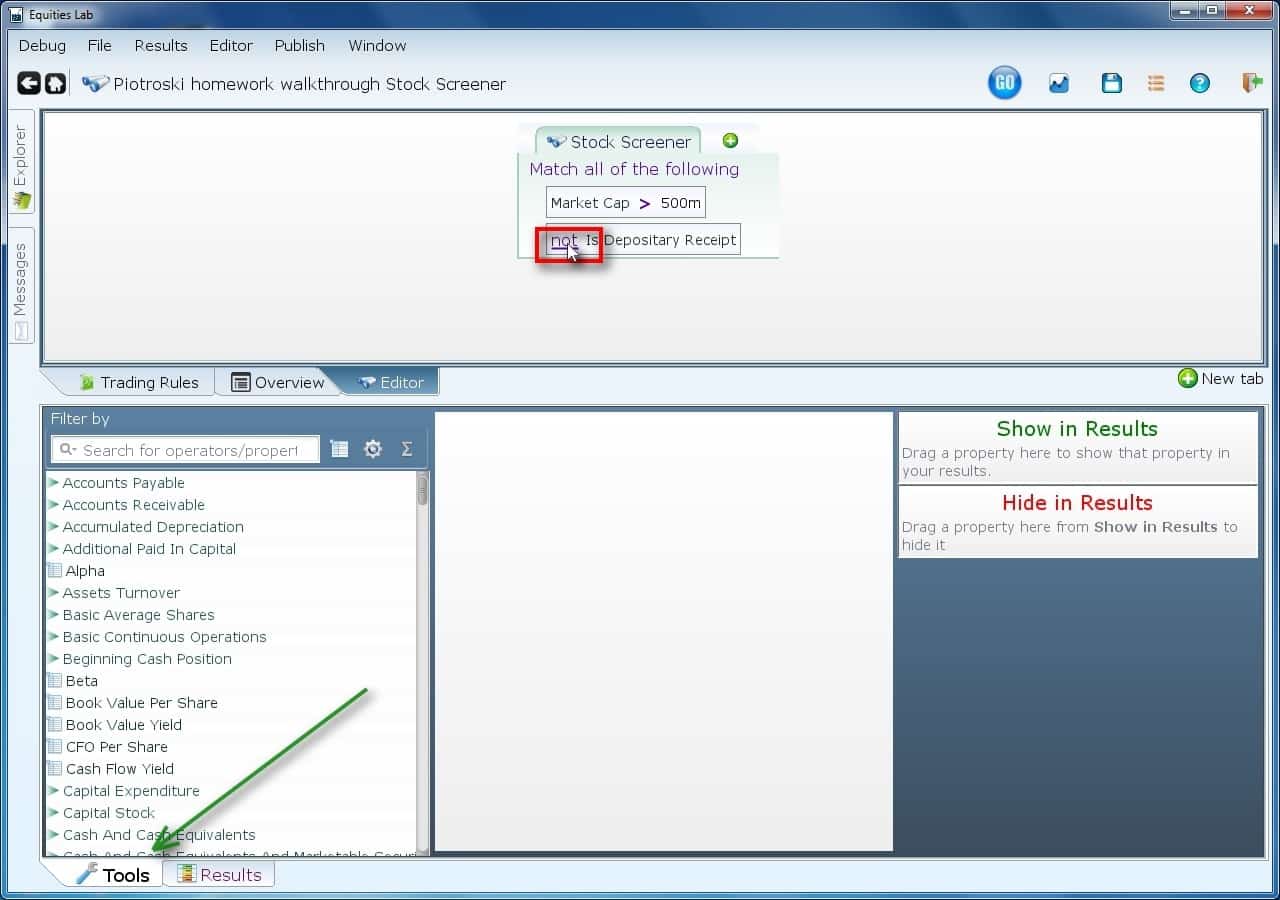
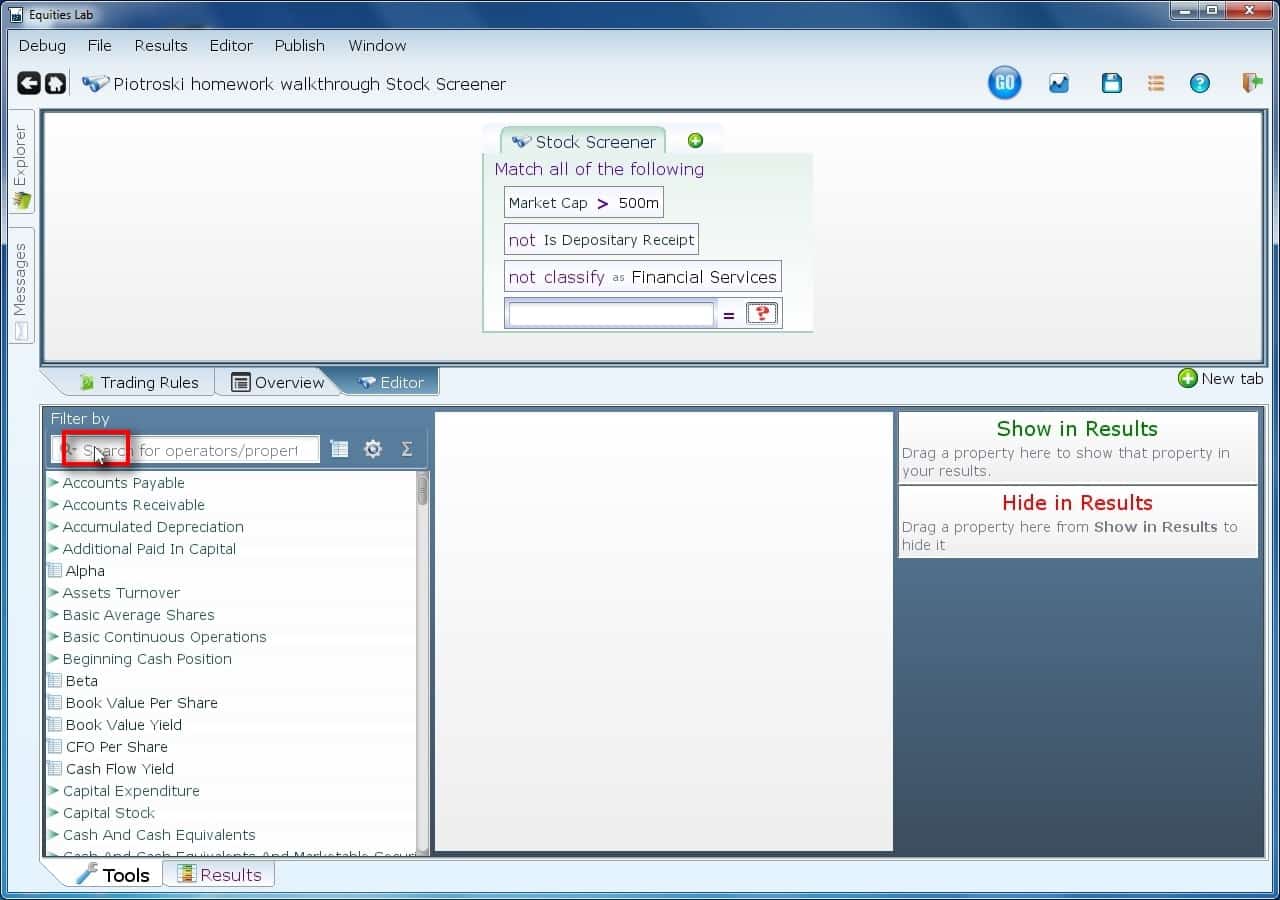
Use the “not” operator to negate a condition — in this context, the condition of being an ADR. Check out the tools menu to find the condition you are looking for. For fun, try searching for “reit” in the tools menu. Where’s the tools menu? In the lower left corner of the window (green arrow).
Create another line.
You do remember how to do this? If not, look back two slides.
Get rid of “Financial Services.”
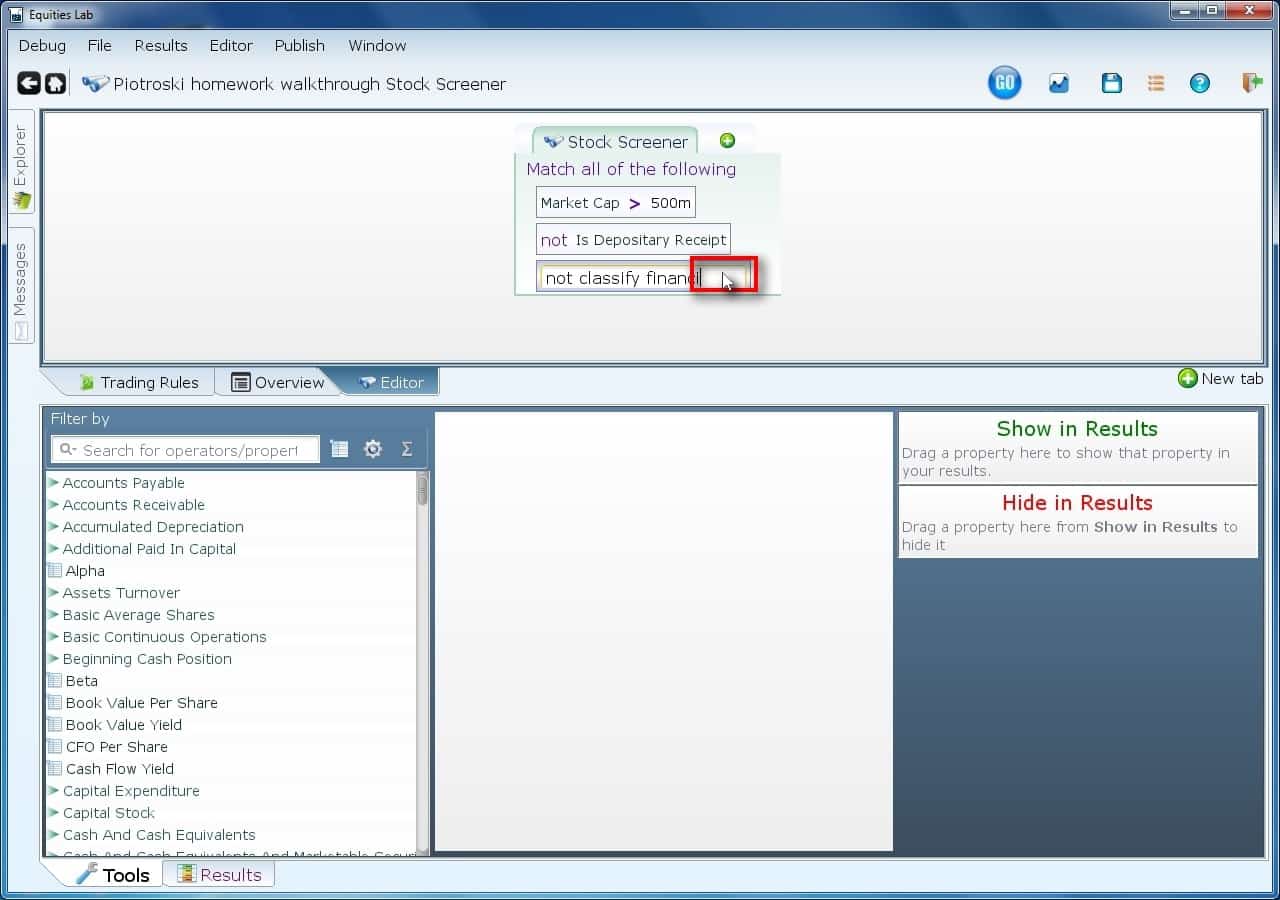
The reason we are exluding the Financial Services is because the Piotroski score doesn’t work well on banks, so they have to go. The “classify” operator is your friend here.
Create yet another line.
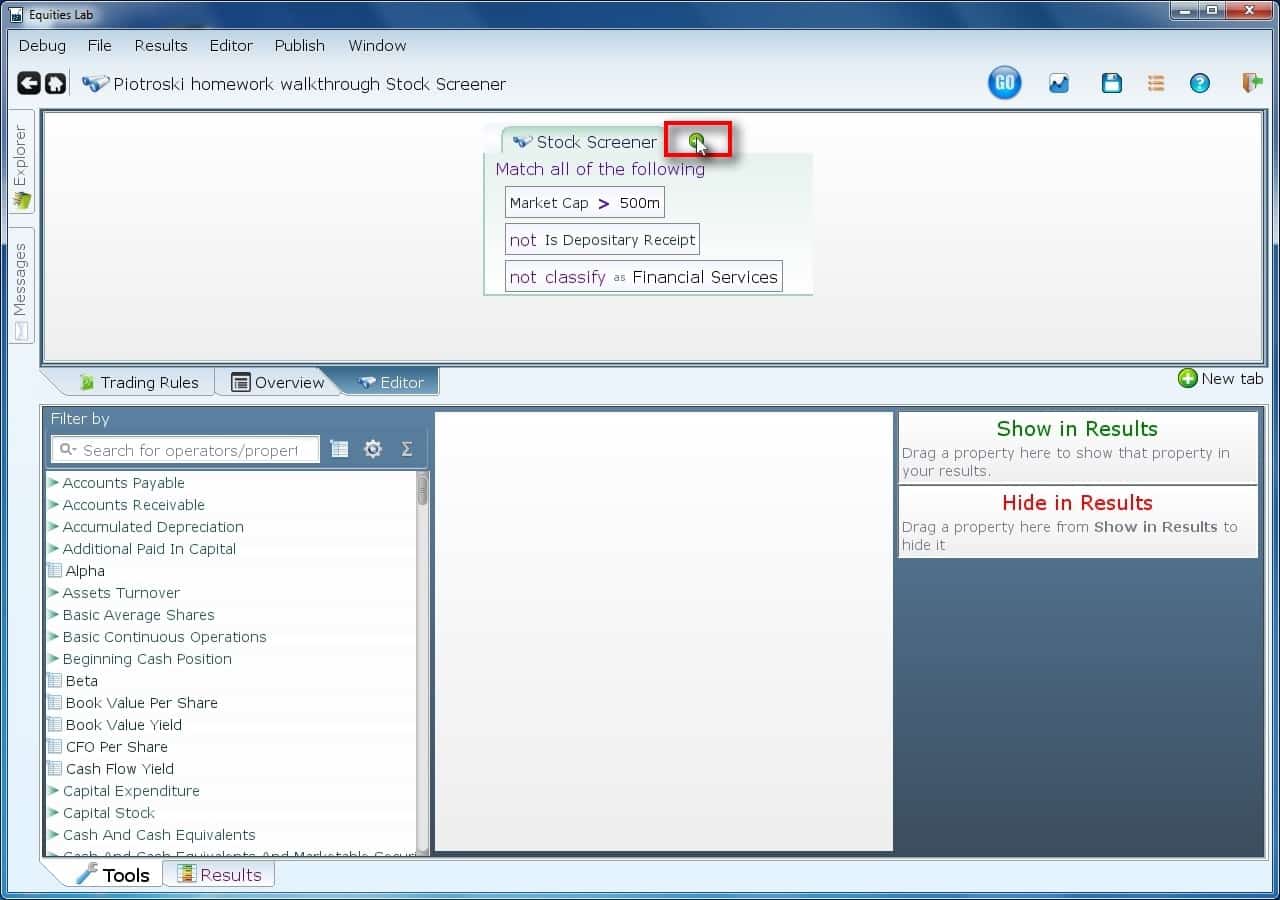
Create a line using a method you haven’t used yet. This new line is going to get the Piotroski condition. If you were doing a rank_across to measure deciles, you’d bundle the lines above into a variable, and perhaps you’d call it restrictions. But you aren’t, so you don’t.
Compare using “=”.
You want to divide each band of stocks into Piotroski score segments. So, you’ll check to find all stocks with a given piotroski score. You’ll notice that if you use a condition that insists that stock make money last quarter, there will be very few Piotroski score 0 stocks. “Why?” is the question left for you. Make sure you can answer it ;-).
Find Piotroski using the tools menu.
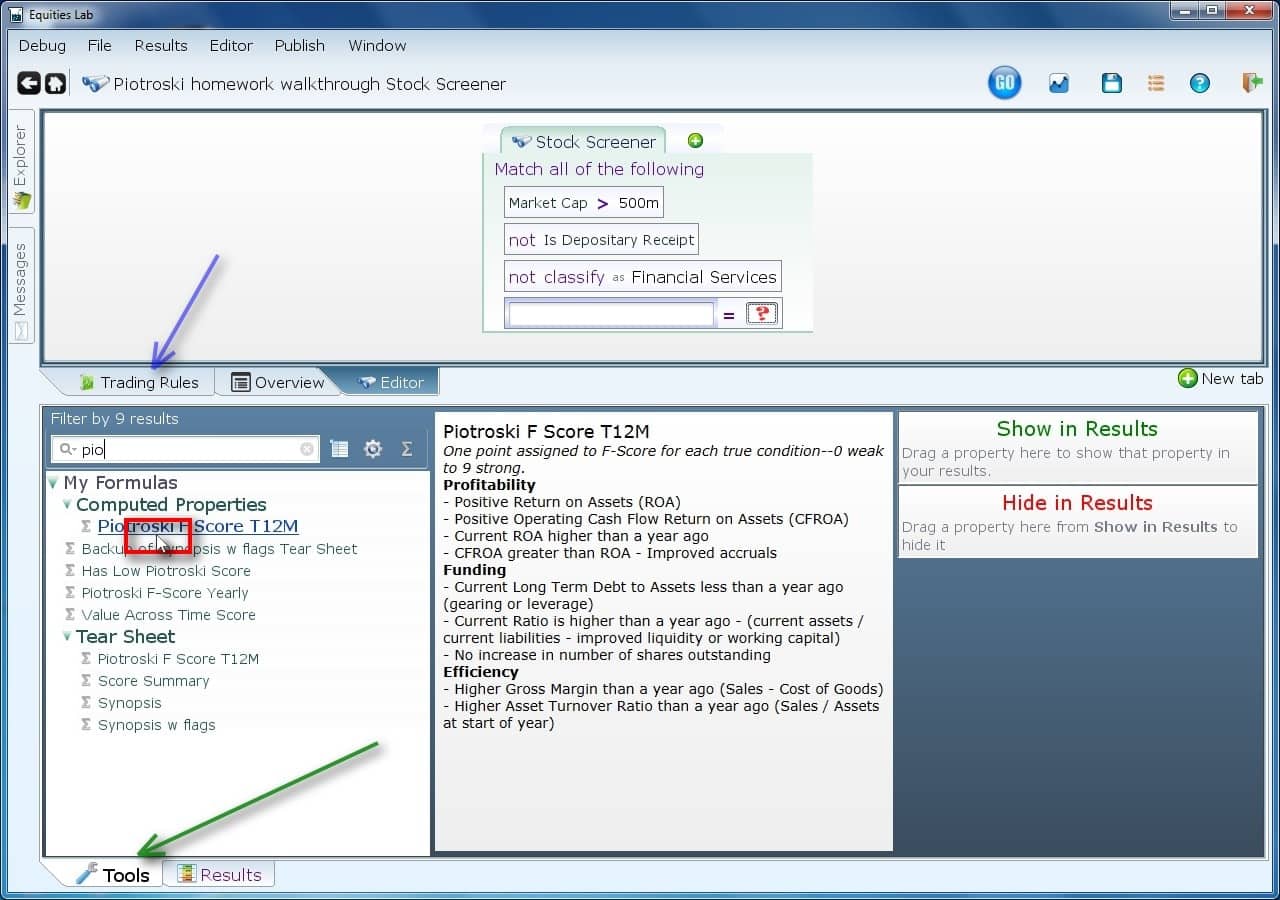
The process for using the tools menu should now be emblazoned in your mind in letters of fire (green arrow first, blue arrow second, click where the red box is).
Fill that second box with monte
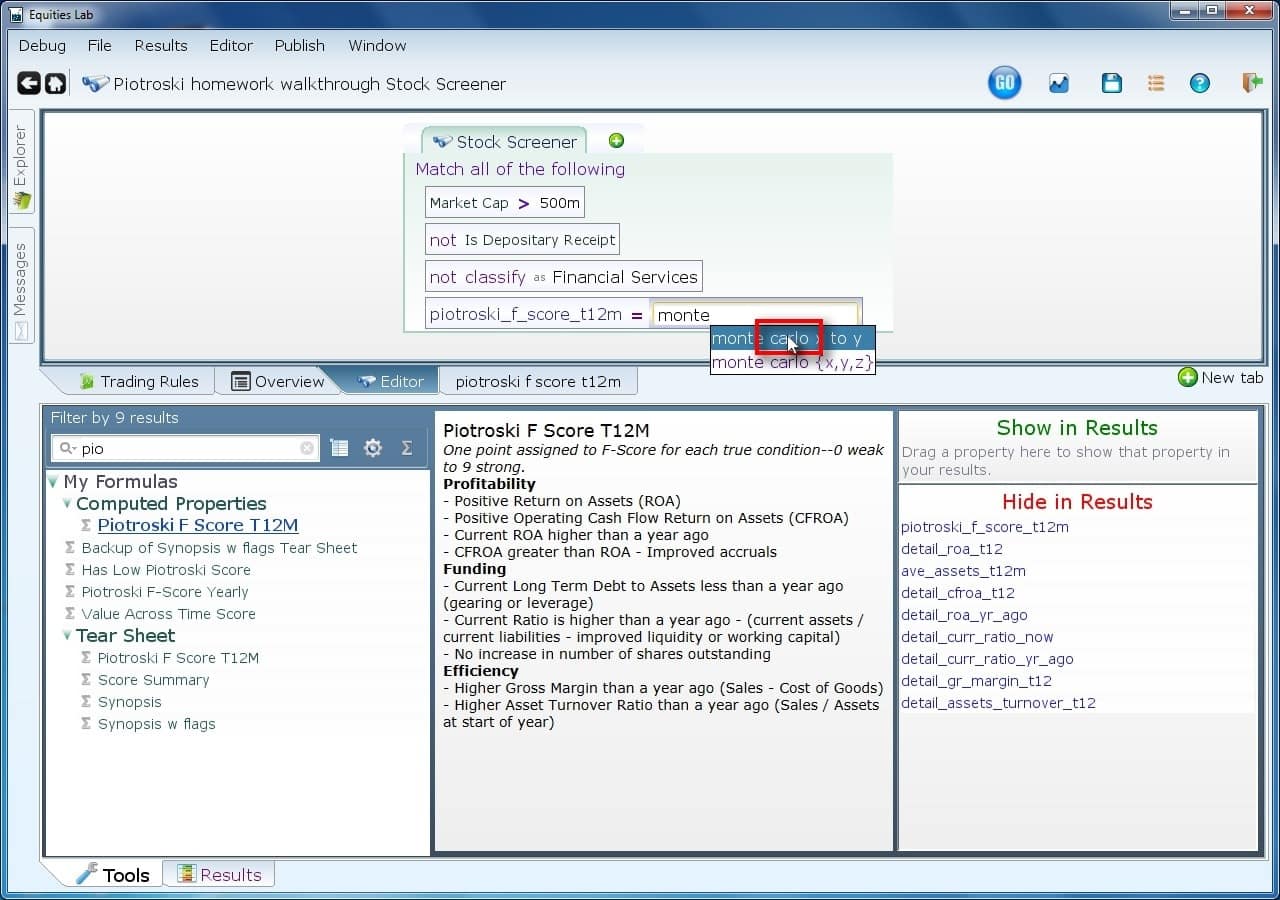
You could backtest 10 times, save off the monthly returns for each series, and compose those. If you did, that would be a longer assignment, especially since you need to do that for earnings yield. So, will you? Nah — use monte carlo instead. That will do all the backtests, and put them all on the same table for you. You are going to choose monte_range (monte from x to y).
Go from 0 to 9 step 1
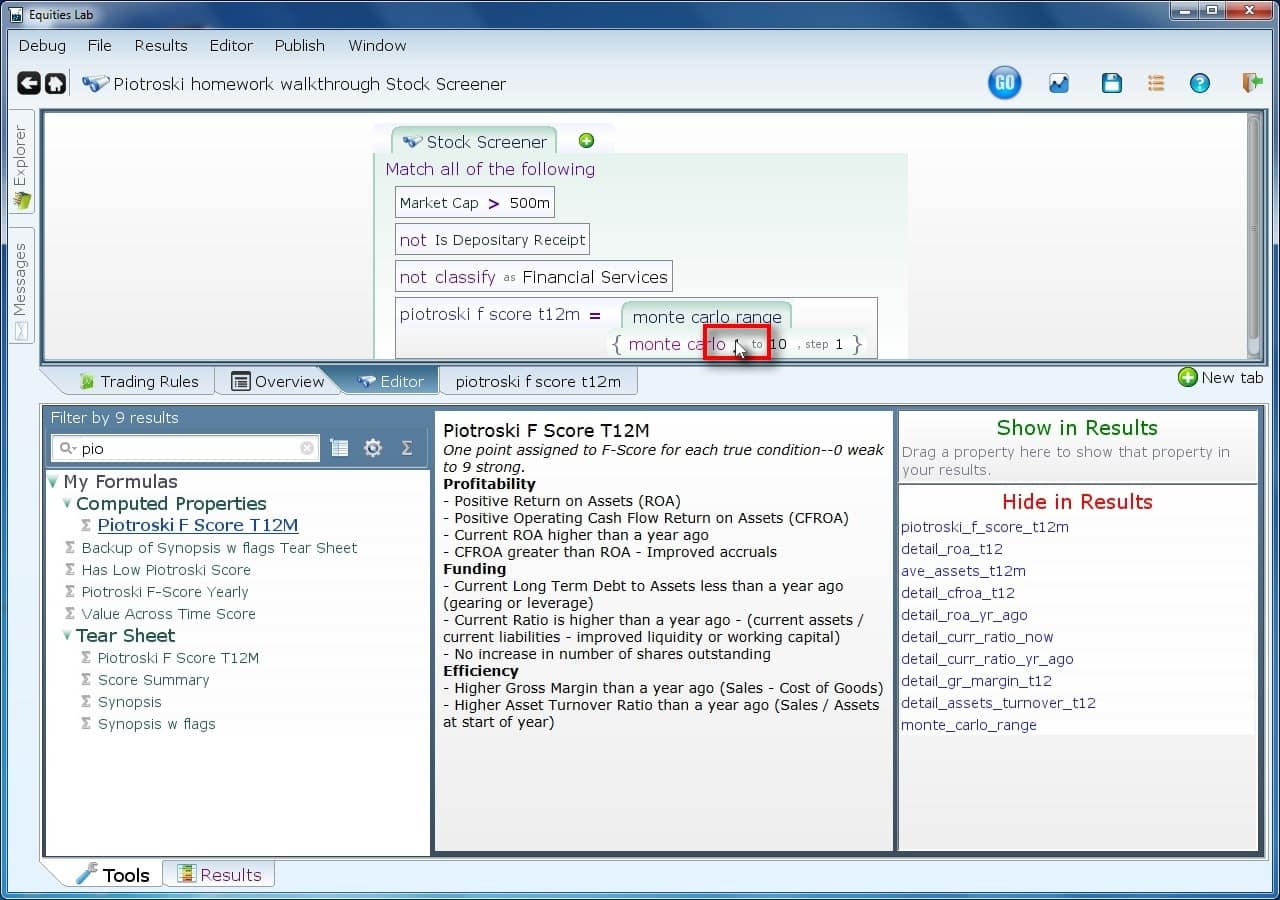
We want to see Piotroski 0, and we don’t want to see Piotroski 10 (Why not? Some mental homework for you to complete.). So, just click on the numbers and change them.
Backtest it!
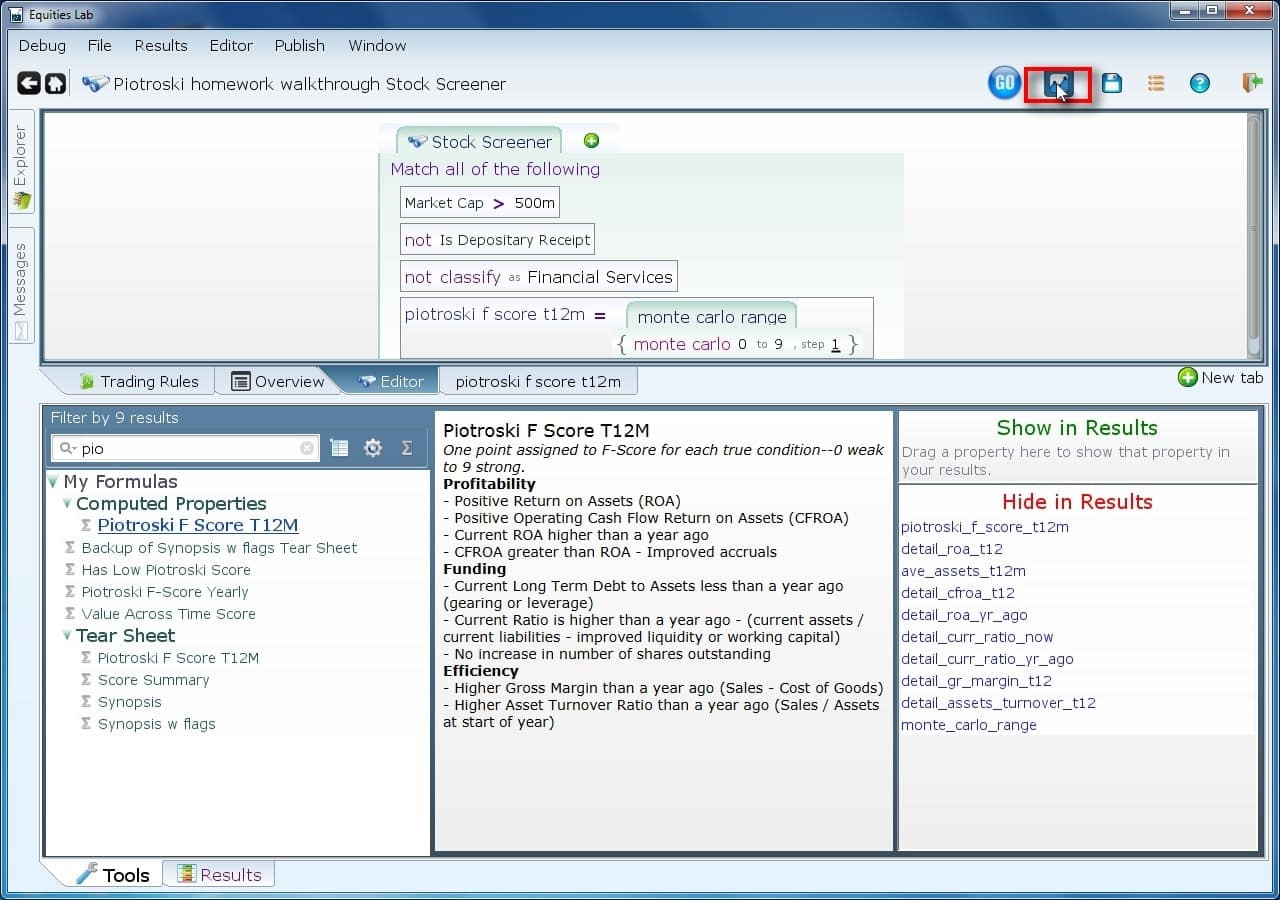
The backtest button is next to the “go” button.
This will take a minute or two.
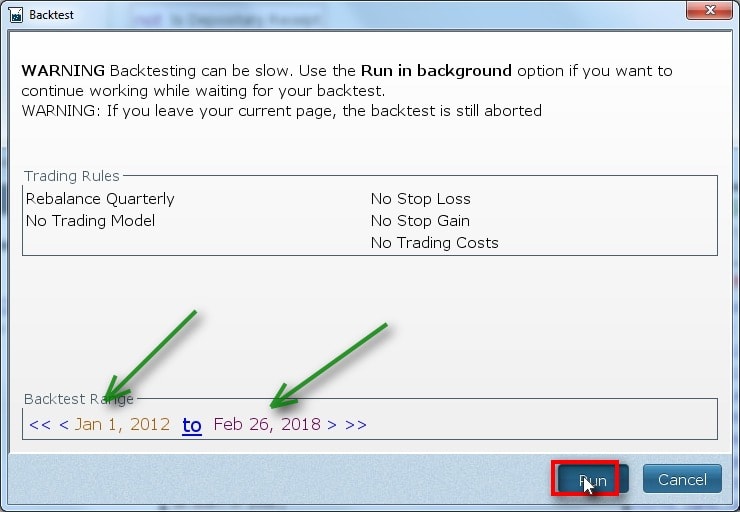
After you click the “run button” of course. You’ll want to change the dates to match the desired range (green arrows).
We only got five lines!?!
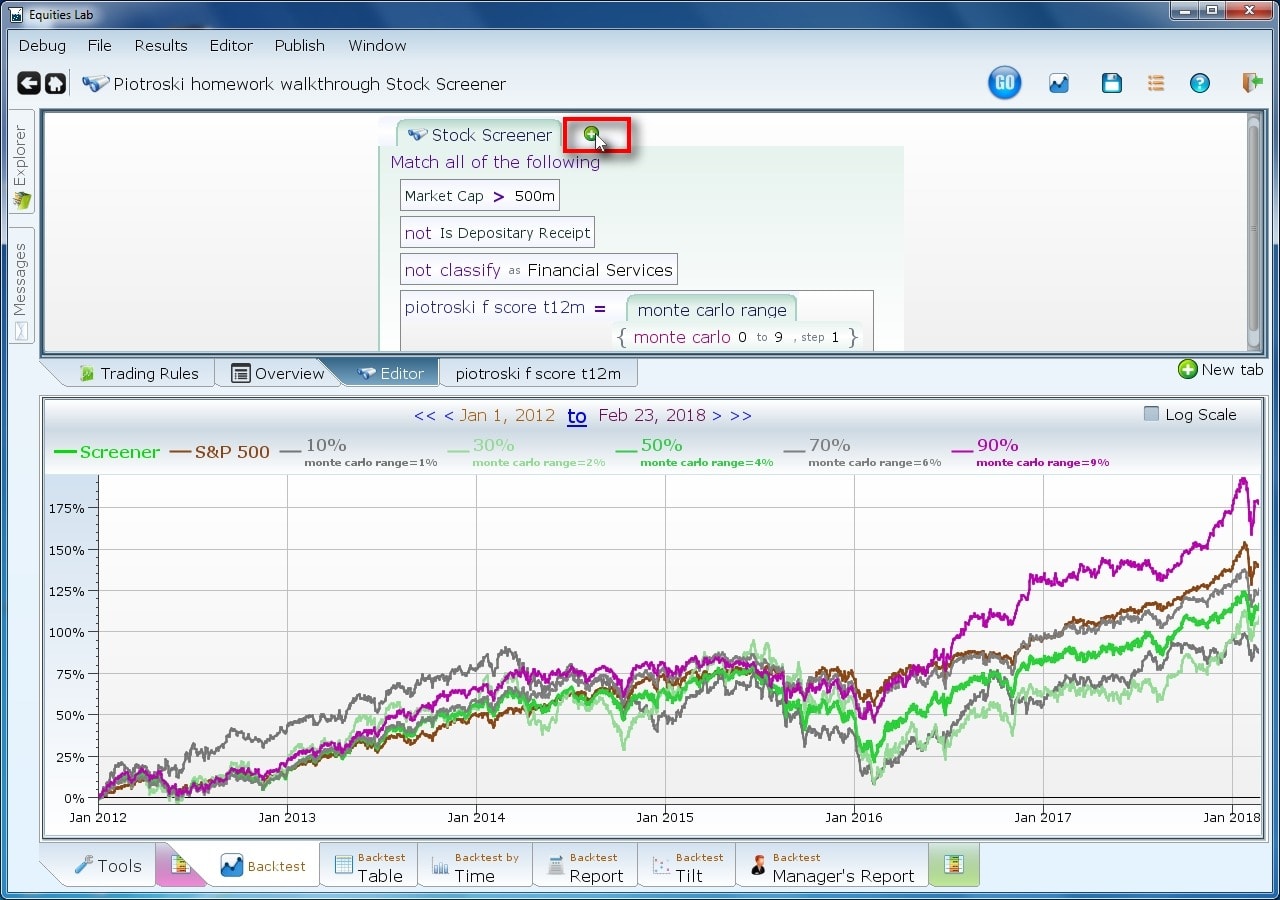
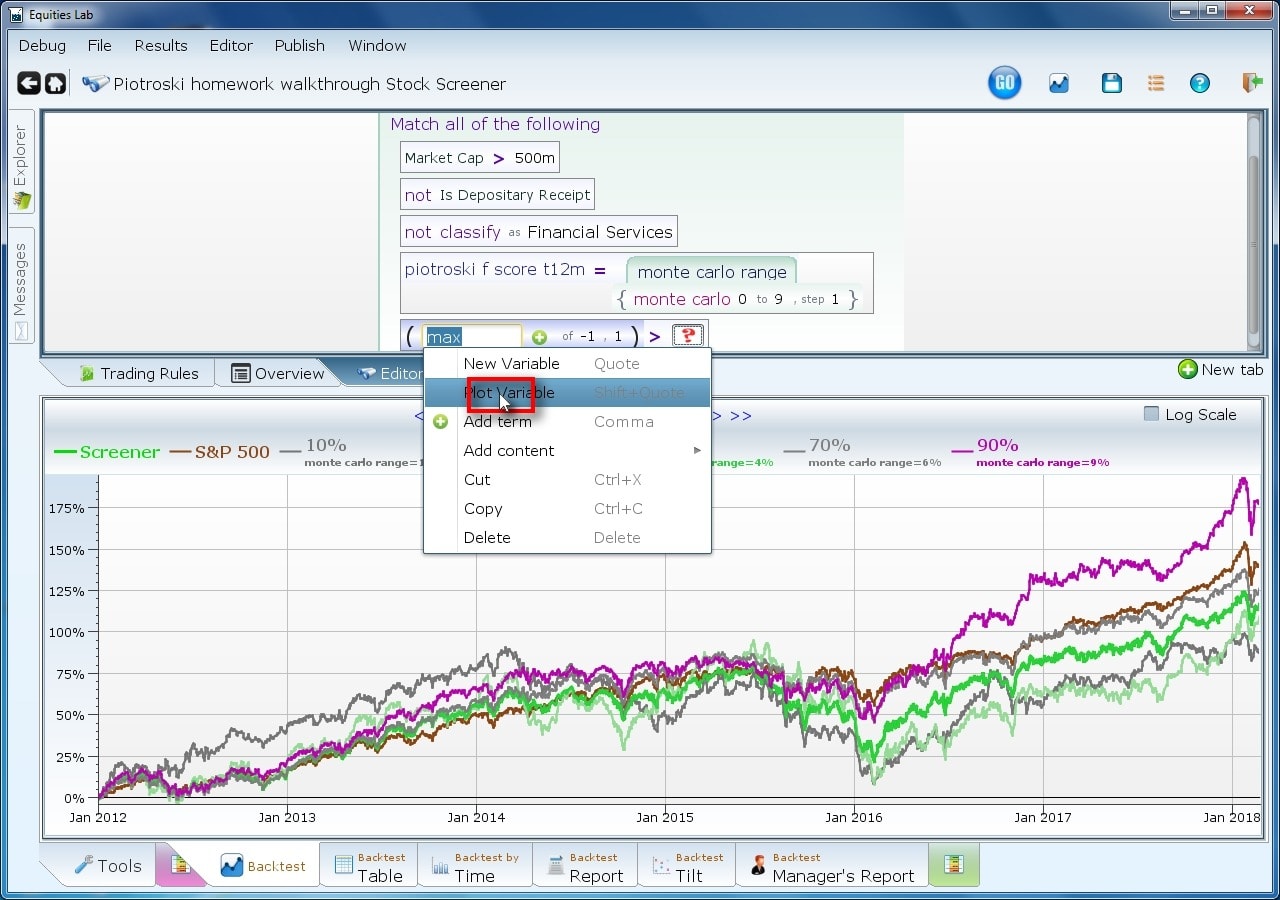
You will notice that there are only five lines. You need to set a magic variable “whic_montes” to “max of -1 1” to get all the lines. Create a new line.
Create a condition.
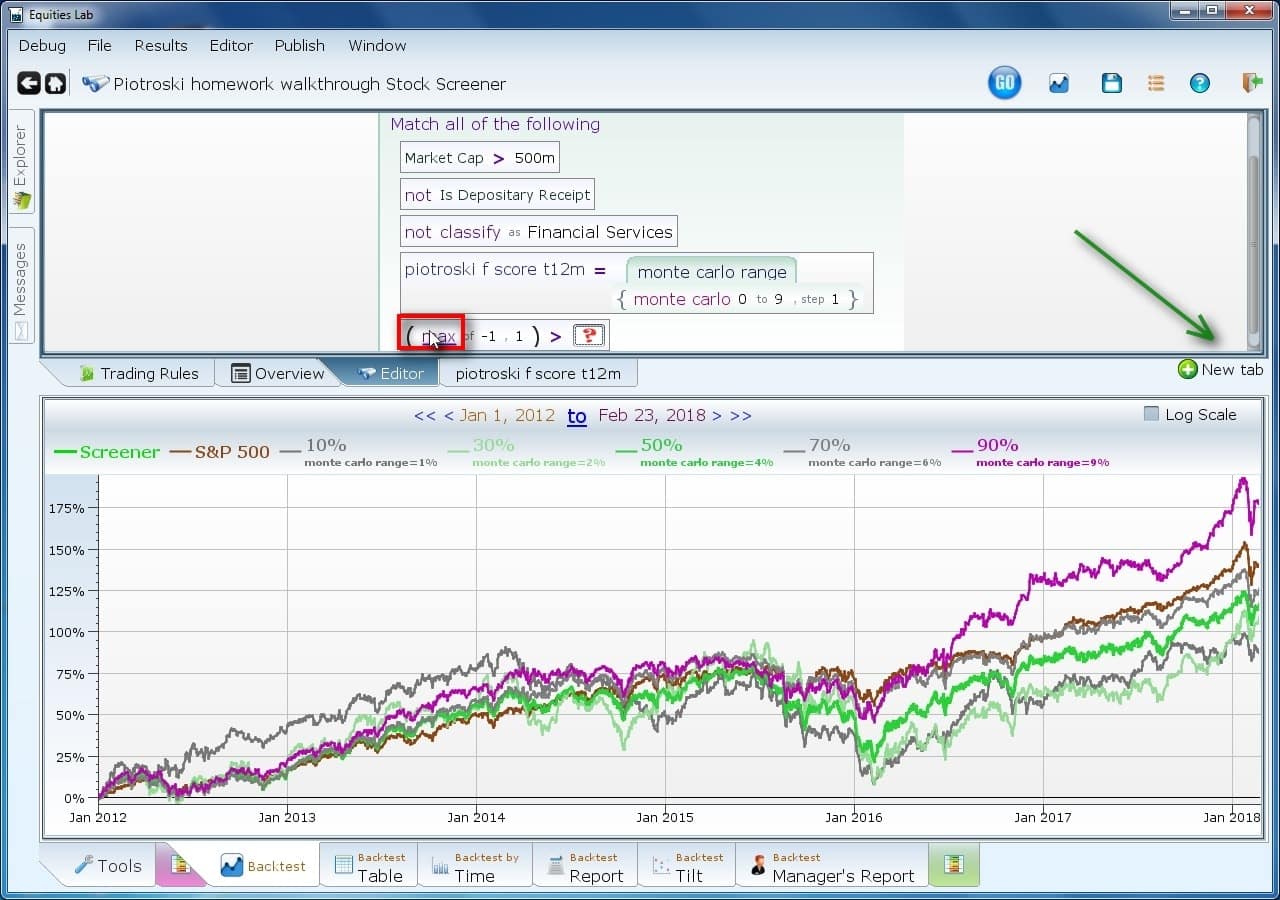
You want this condition to be always true, but have “which_montes” in it. Unfortunately, you need somewhere to put it. Hence, the need for a new condition which is always true. Of course you could just use a new tab (new tab button pointed to by the green arrow or CTRL T).
Name the left side “which_montes”
Use the menu to name the line, or use the single quote key to do the same thing.
Backtest again.
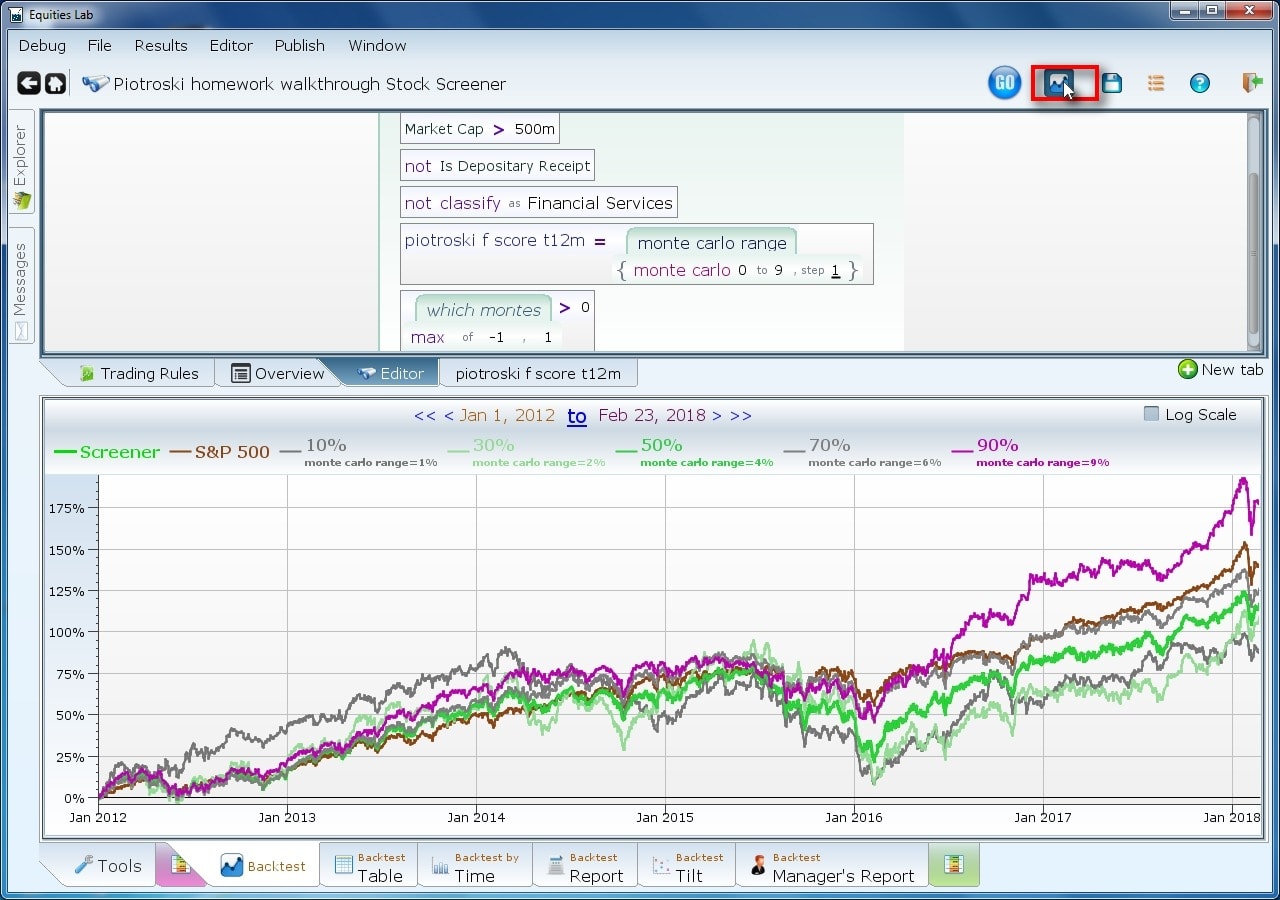
The backtest can be accessed by CTRL B, or by the button which is still by the go button.
If it takes too long, you can put the task in the background.
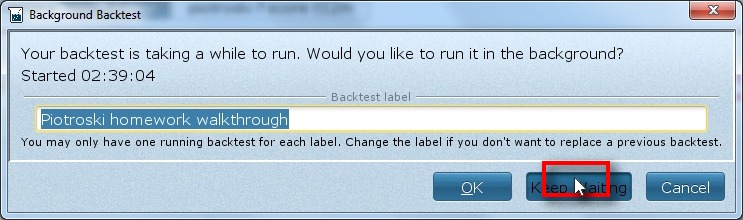
Or you can just wait……
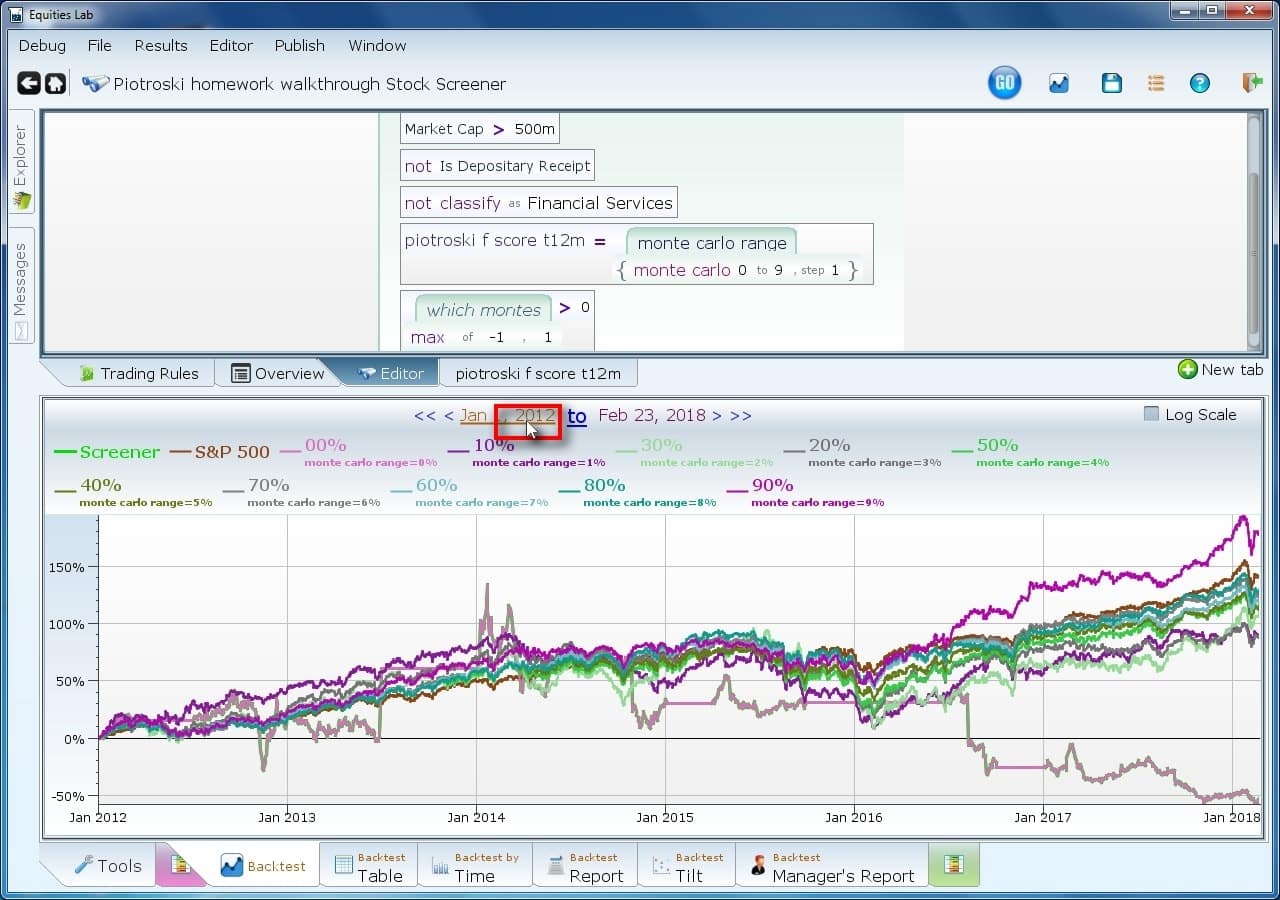
Those are some pretty results.
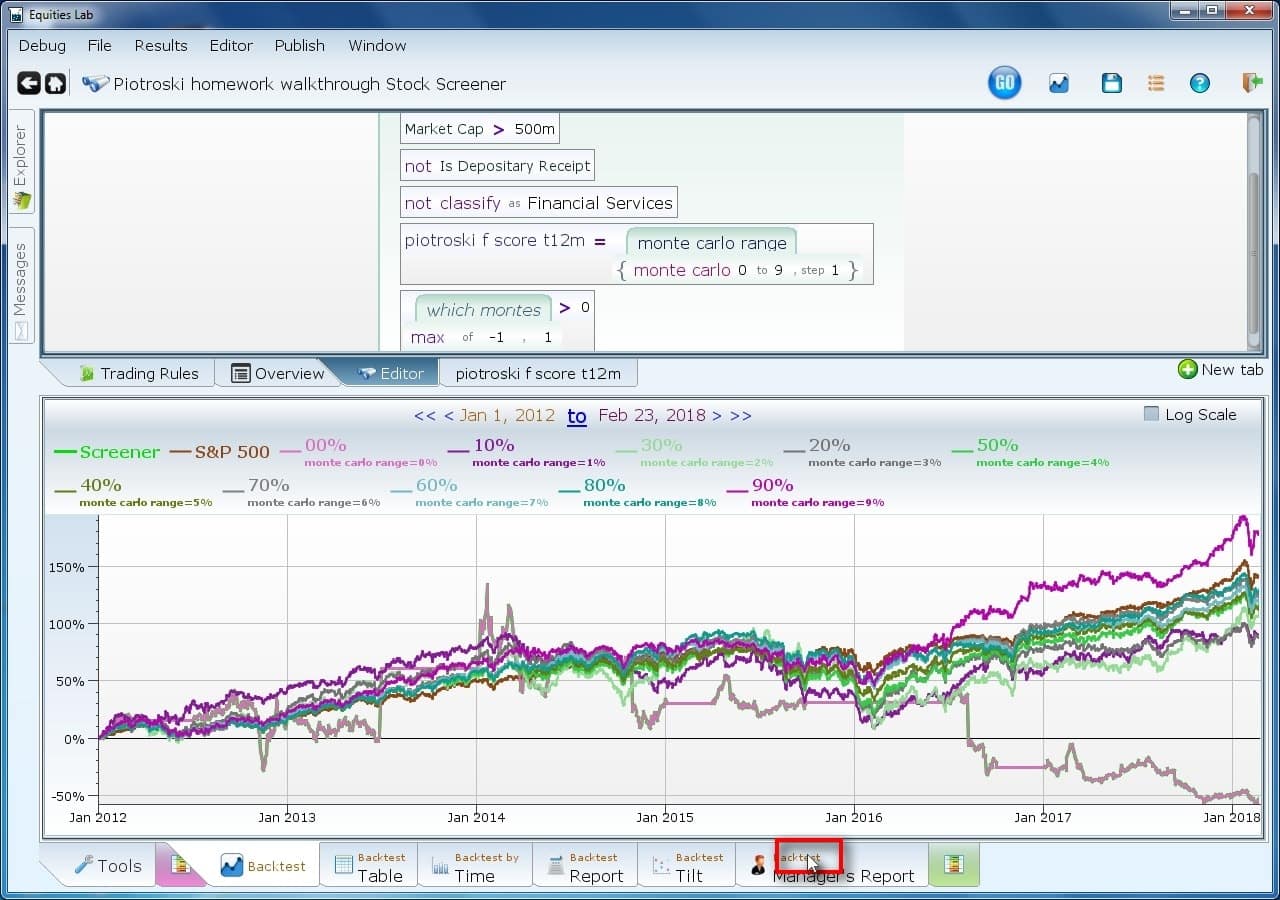
The manager’s report will give you monthly returns. Try clicking on all the tabs at the bottom. With a monte-carlo, the green shaded tabs won’t have results, but the others all have interesting info. If there is no monte carlo, the green shaded tabs go into detail about all the trades.
View the massive table and see if you can assess anything about the data.
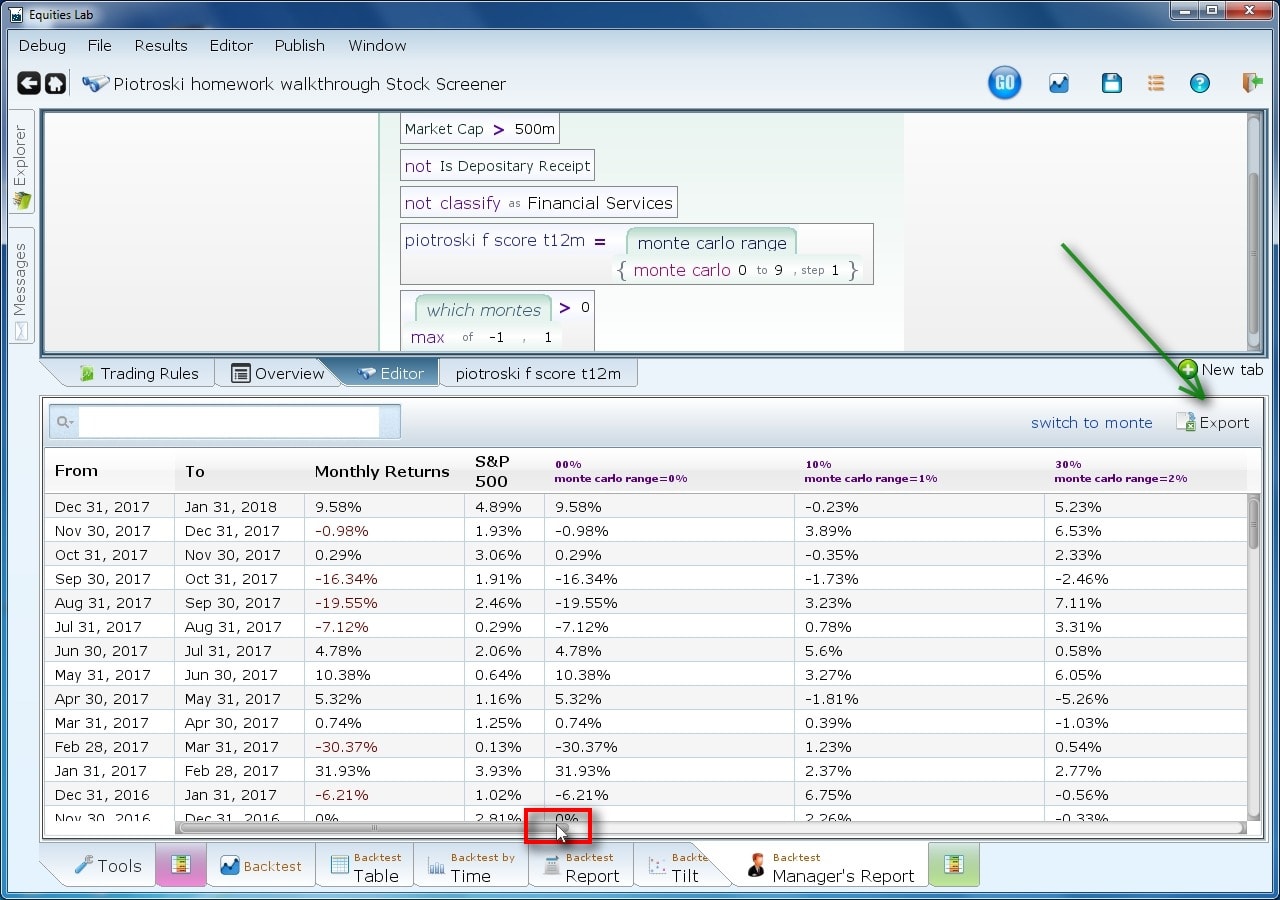
The monthly returns are sorted vertically by date, and horizontally by Piotroski score. If you need to export to Excel, use the “export” button (green arrow).
You potentially need to change the dates.
Try clicking elsewhere to see what happens.