
Overview
Crafting Strategies
Backtesting
UI Features
Common Models
Putting Piotroski to the Test
What Is the Piotroski Score?
The Piotroski score is a 9-point checklist to determine if a company is healthy. The higher the score, the healthier the company. In this article, you will get an in-depth explanation of the formula, how it works, if it works, and future performance indicators. The formula is shown below:
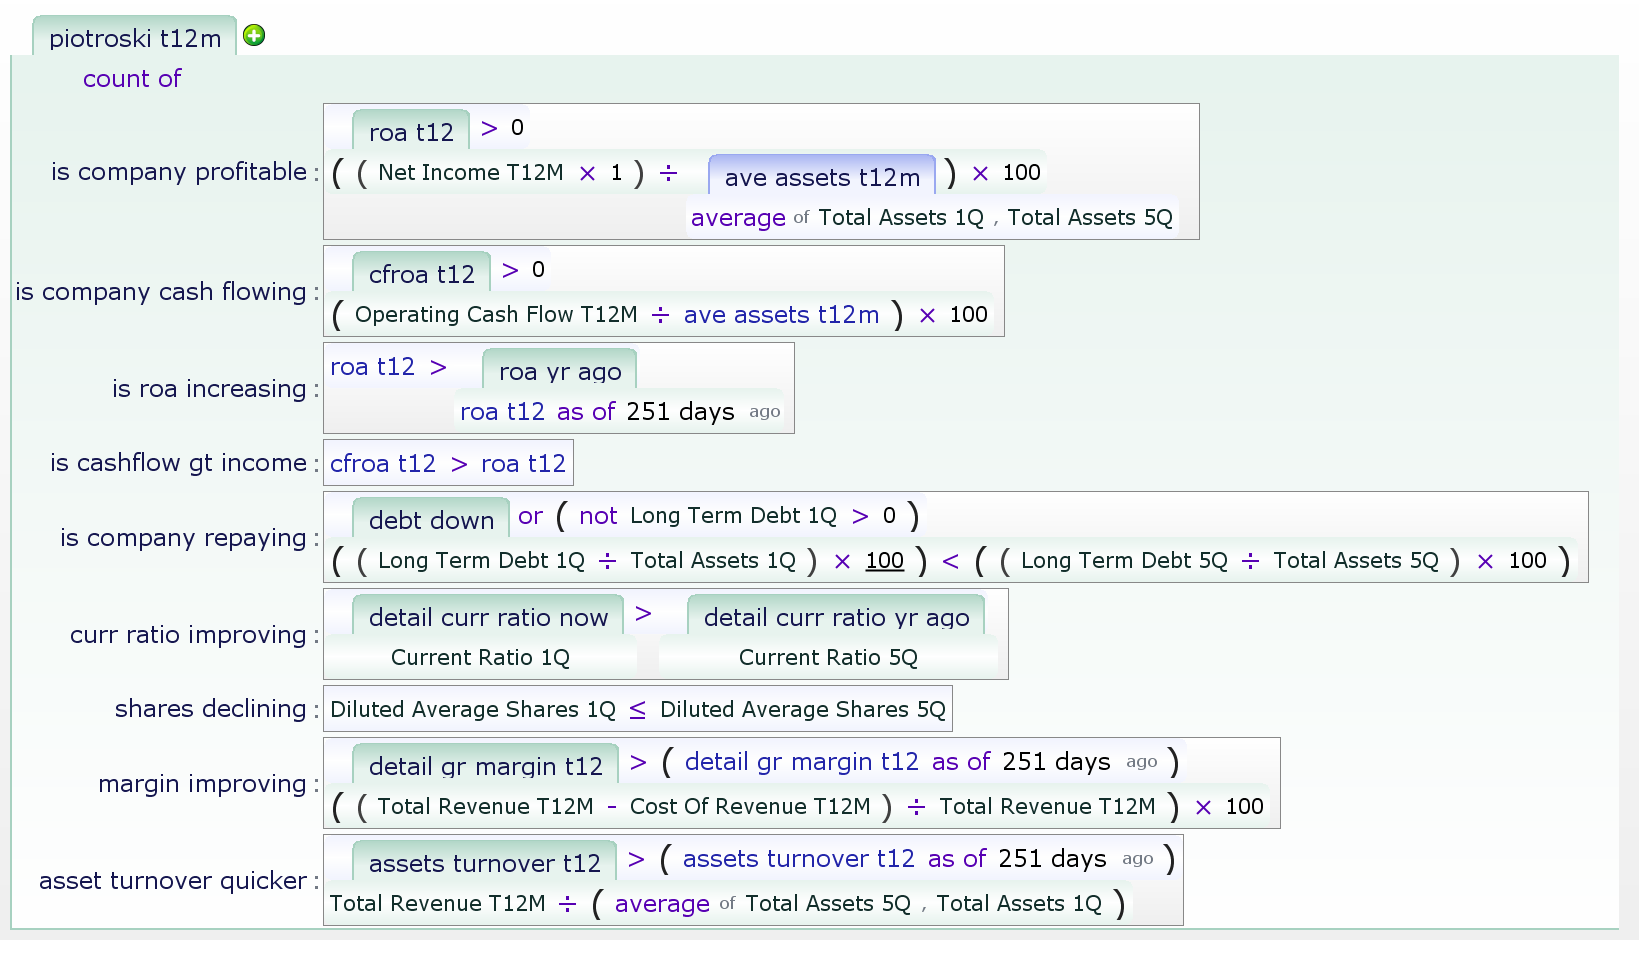
- Is_profitable – making money gets you a point. It seems trivial, but money-making companies are less likely to go out of business.
- Is_cash_flowing – companies with positive cash flow can spend that cash if needed. Companies without a positive cash flow must raise money, even with positive income.
- Is_roa_increasing – being able to squeeze more income from the same assets is good.
- cashflow_greater_than_income – net income is not as useful as cash flow, and accrued income has a way of vanishing.
- Is_repaying – No debt is good, as is a shrinking debt-to-asset ratio.
- Curr_ratio_improving – high current ratios are good, and increasing ones are better.
- Shares_outstanding – shareholder dilution means more shares are needed to get the same income/dividend/etc.
- Margin_improving – If a company can make more money on a given volume of sales, that portends more profit.
- Asset_turnover_quicker – if a company can get more sales from the same set of assets, that also portends good things.
These ratios were derived by Joseph Piotroski, who used a linear regression of them to determine the odds of company failure. He and several others determined that small-cap value stocks could outperform if filtered on Piotroski score.
Does Piotroski score predict company performance?
It seems to. Due to the complexity of the 9 components woven throughout the formula, a company that fits more criteria will perform better. The below image demonstrates what a 20% score looks like all the way up to a 90% score. 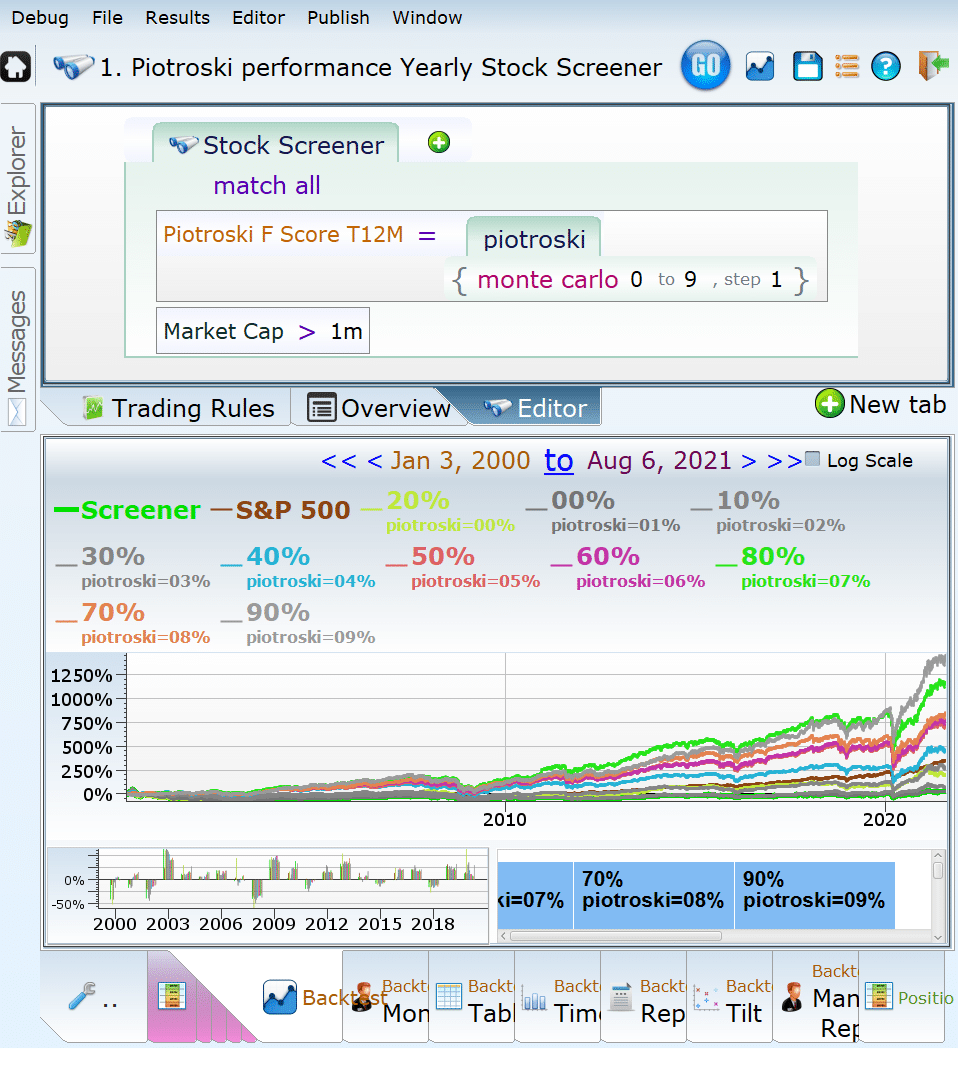
Is the Piotroski F-Score a signal of future performance?
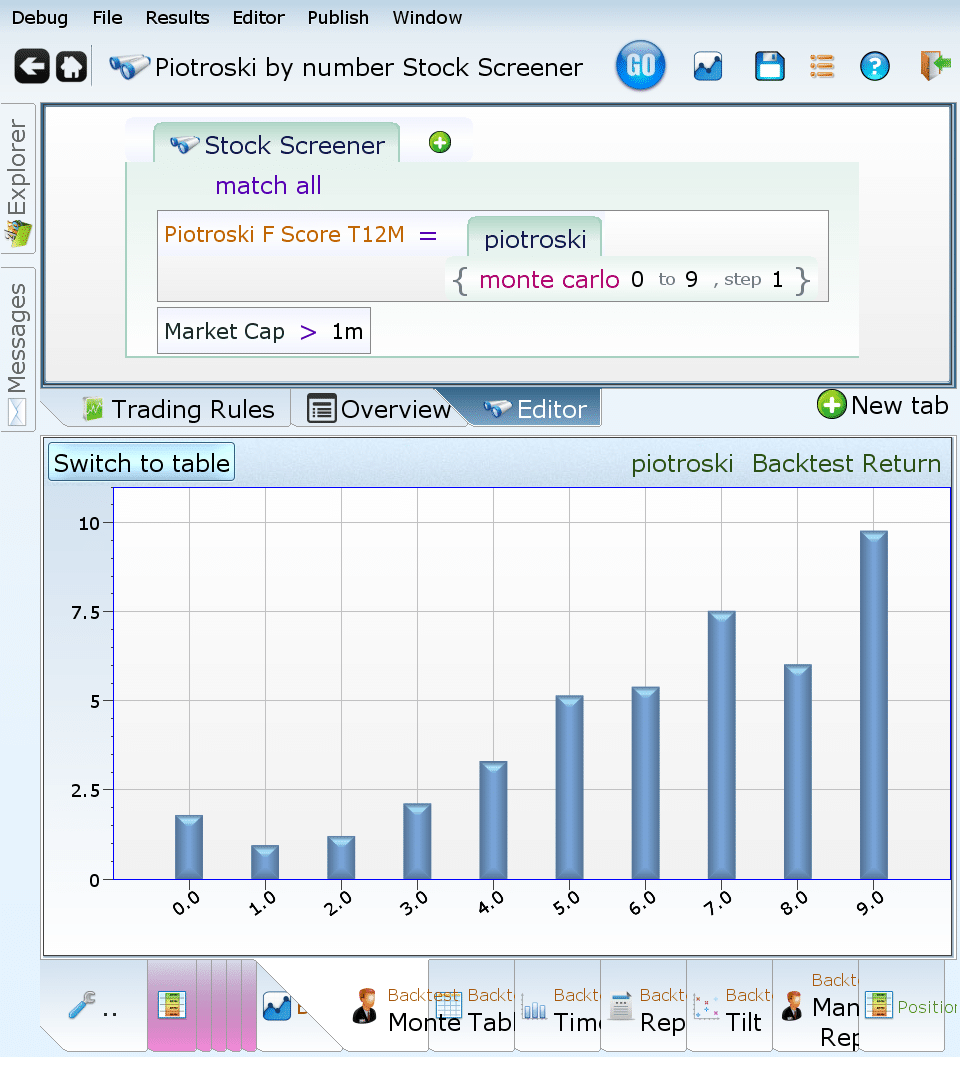
The chart below shows the backtest of each Piotroski value from 0 to 9. It sure looks like the higher values perform better and the lower ones perform worse. That said, there are lots of little lines there.

The bar chart tells a stark story of improving performance by Piotroski level. In other words, whether presented in a chart or a graph, the higher the Piotroski value, the better the stock does, on average. (As an exception, the zero Piotroski value does better than the one value, which probably means something funky is going on.)
WARNING: Piotroski has not been as predictive in recent markets as it was in the past. If you used 2016-2021 as a guide and ignored any older data, it seems like the 0 and 1 levels are predictive of bad performance, and that’s as far as it goes. The 2-value screen defeats everything else.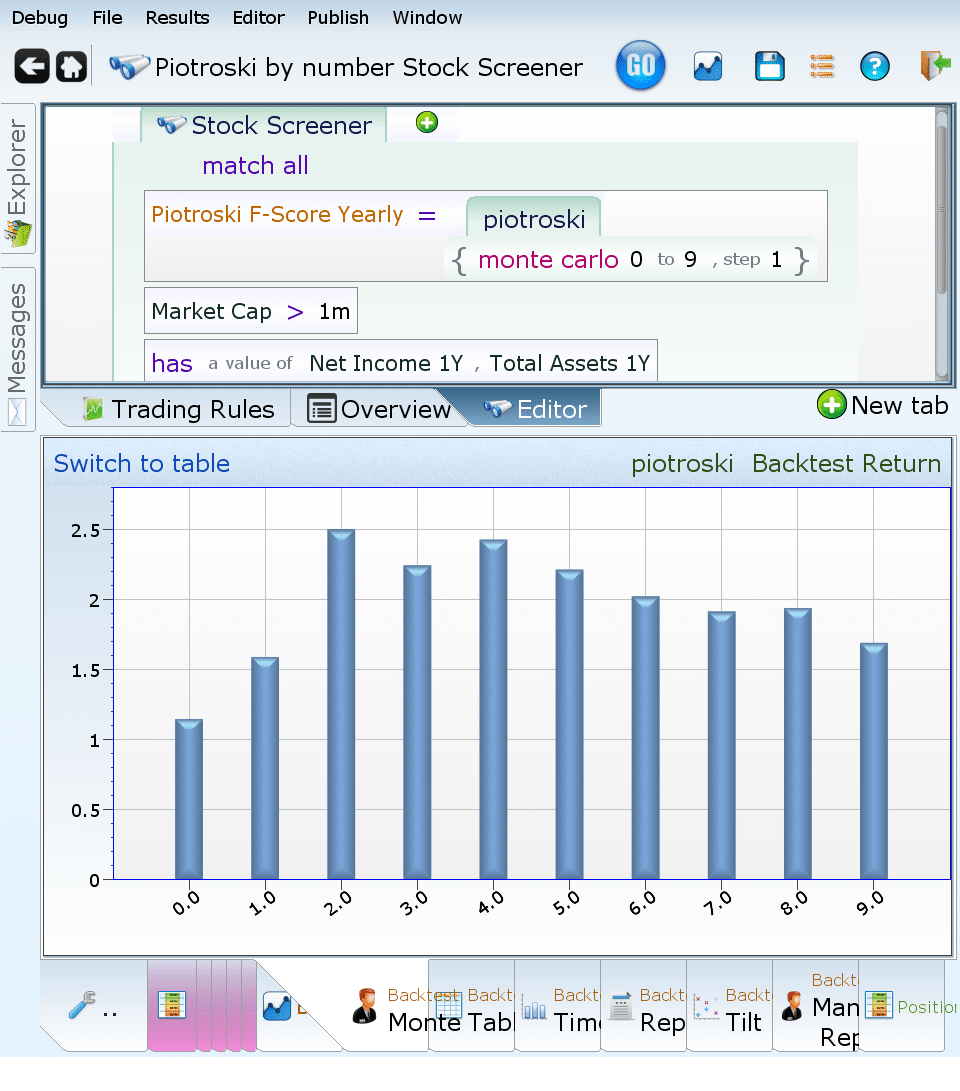
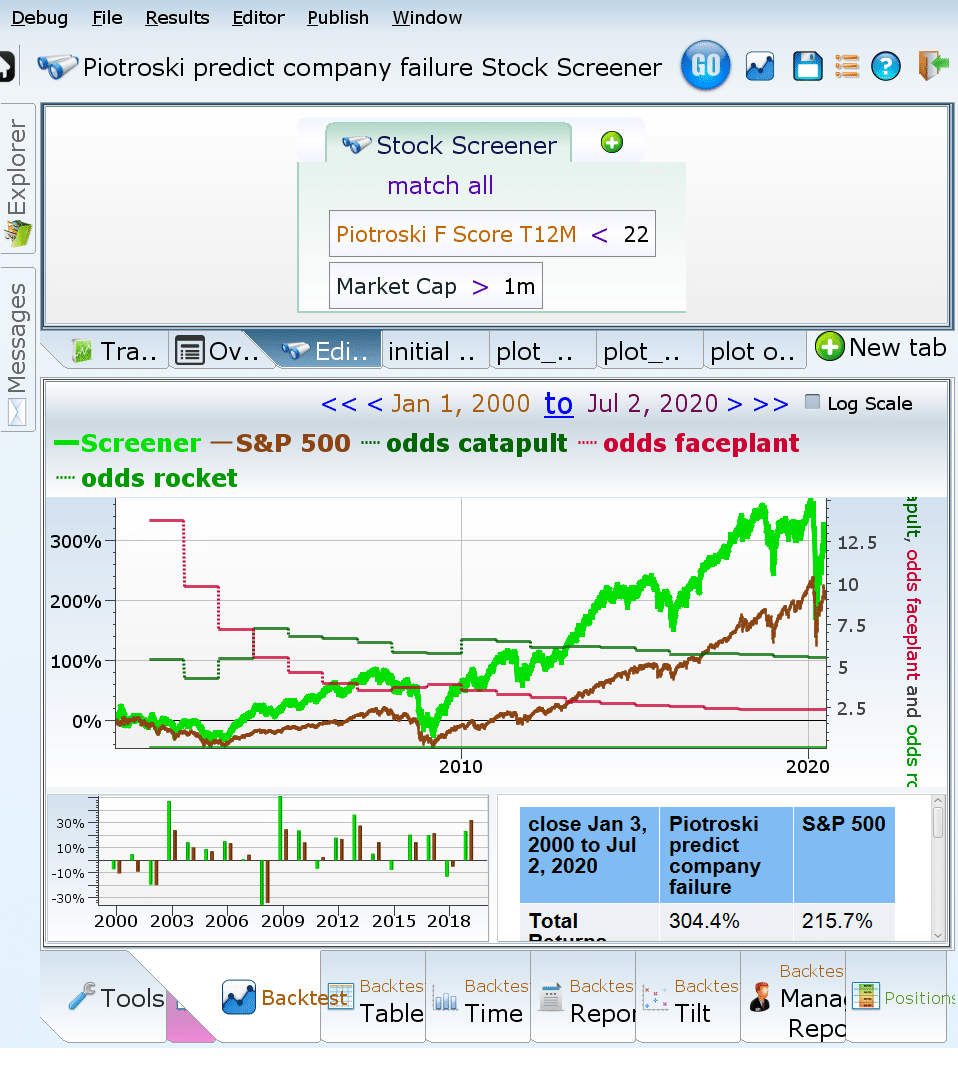
Does the Piotroski score predict company failure?
According to Value Investing: The Use of Historical Financial Statement Information to Separate Winners from Losers, 2% of the companies considered in his paper with the highest Piotroski score delisted for performance reasons, while 7-10% of the firms with Piotroski 2 or lower also delisted. That seems to be a pretty big difference and a reliable indicator of what stocks could potentially be delisted. Equities Lab does not have performance-based delisting, so we count the number of firms that lost more than 80% of their value within one year after matching and call that “faceplanting.” For firms that are delisted, the last available price was used as the value.
If you’re in the position where your stock “faceplanted”, remember it isn’t the same as it being delisted, but it is still traumatic to endure. You should check the odds that the stocks will catapult upwards (80% gain in one year) and that they will rocket to new heights (500% gain in one year). If an investor has a portfolio of two stocks, one of which faceplants and one of which catapults, the investor neither gains nor loses money. If an investor has a one-stock portfolio for two years and it faceplants the first year, then it would need to rocket upwards the second year to get the investor back to even. Another reason portfolio diversification should be a priority.
Visuals of the Piotroski F-Score Predicting the Future
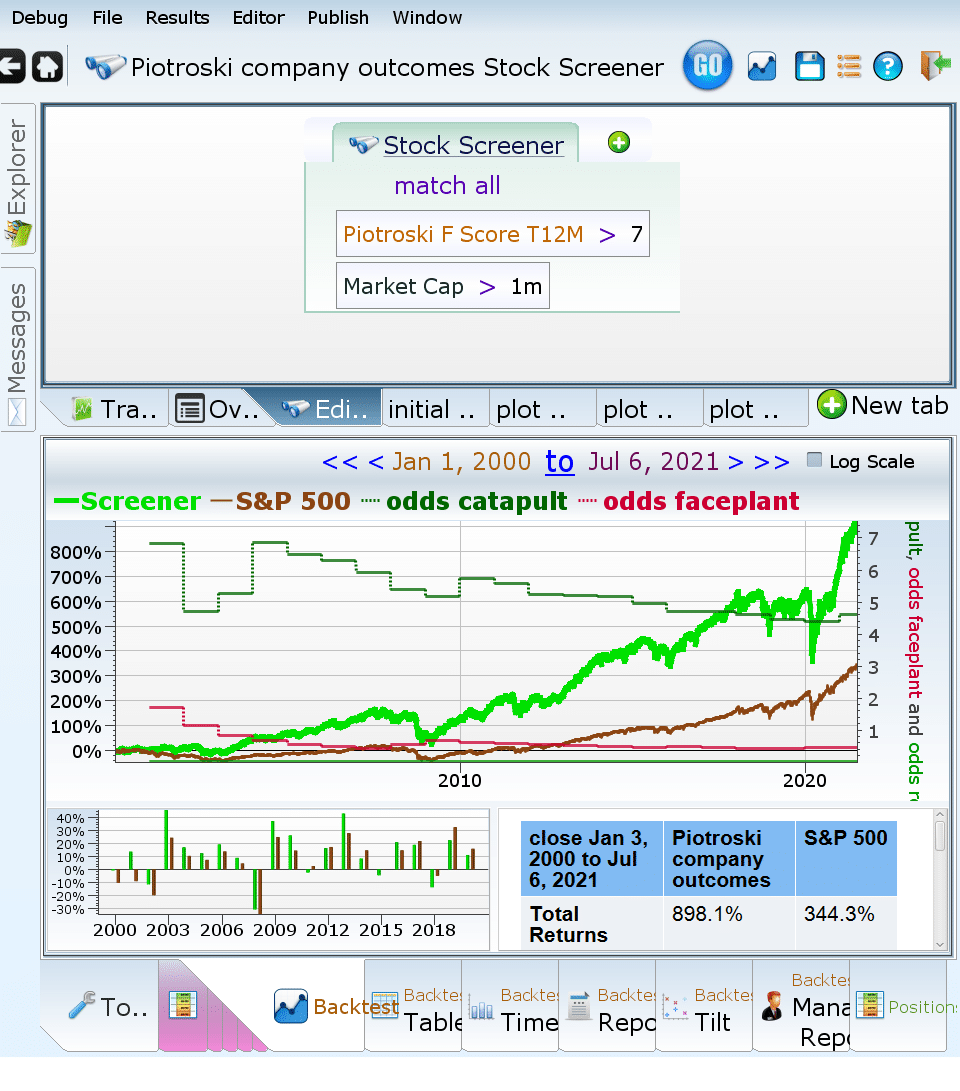
The next three images answer the question of how predictive the Piotroski score is for faceplanting, catapulting, and rocketing. The first image is all investable stocks, regardless of Piotroski score, and shows that 5% catapult, 2.5% faceplant, and about then .08% rocket upwards. The rest didn’t perform exceptionally in either direction.
For high Piotroski score companies, there are fewer faceplants – only 0.4%. There are also very few rockets — .01%. But there are almost as many catapulting companies (4%). Perhaps it is not surprising how well a company that scores high on Piotroski F-Score does.
Low Piotroski companies, on the other hand, have more rockets — .16%, but double the number of faceplants that all companies do, at 5%. These companies are no more likely to catapult upwards, as that average is still 5%. Buying them is like buying lottery tickets: possibly fun but also possibly very un-profitable.
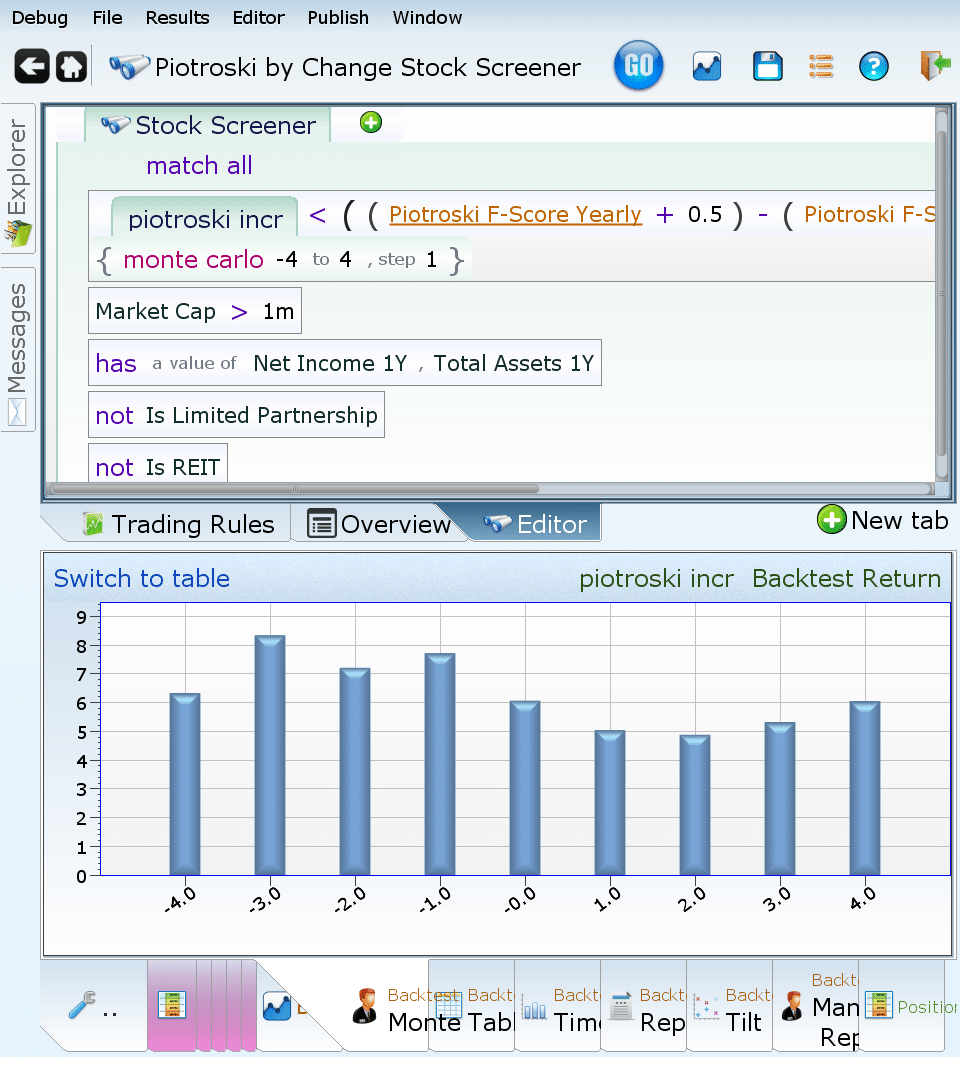
Is a changing Piotroski F-Score a signal of future performance?
Apparently, a declining Piotroski F-Score is good for a stock. Although this seems absurd, this makes sense when you consider the choices available to a stock with a Piotroski score of 9. It can stay the same, go down a little, or go down a lot. Conversely, a Piotroski 0 stock has nowhere to go but up.
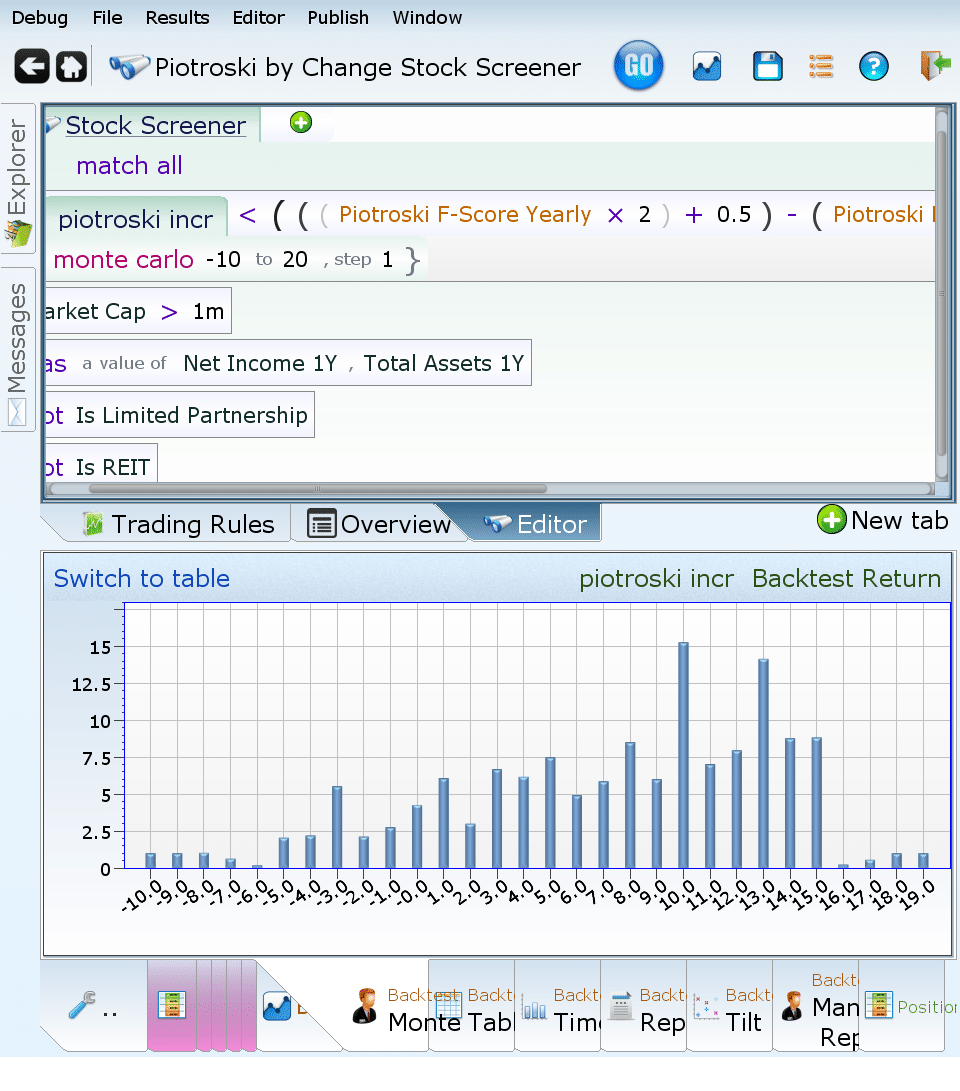
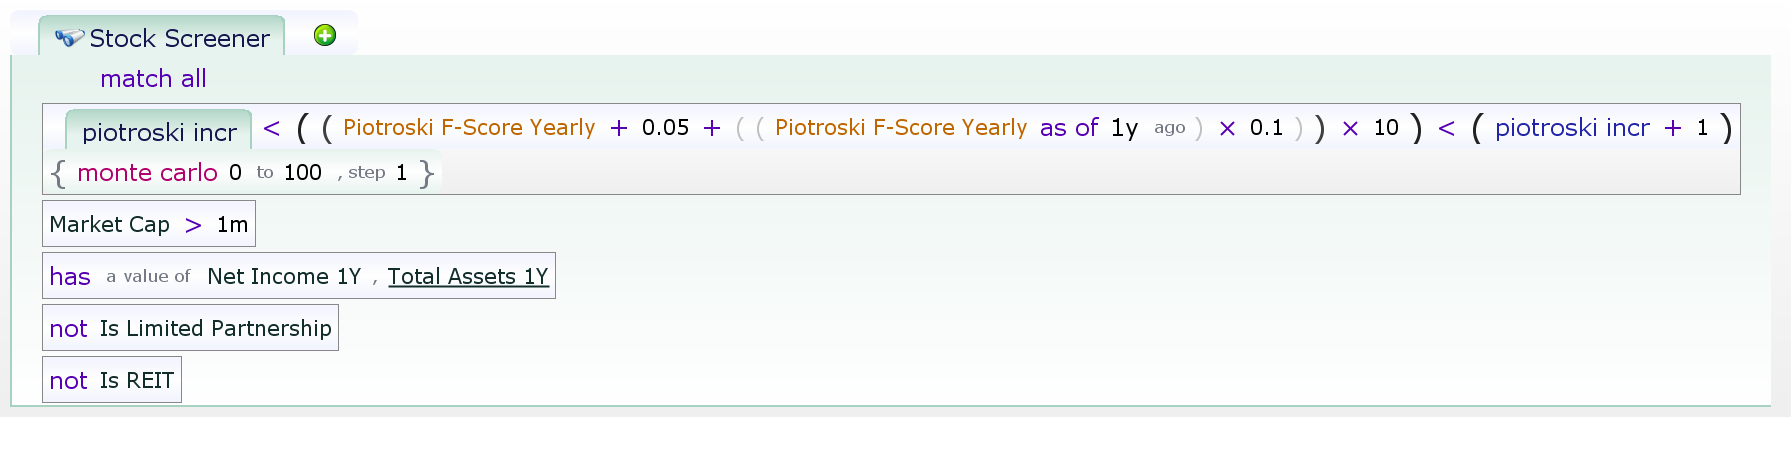
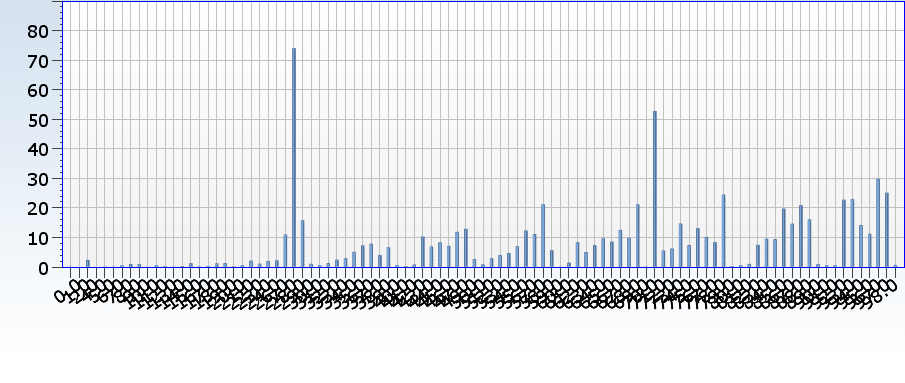
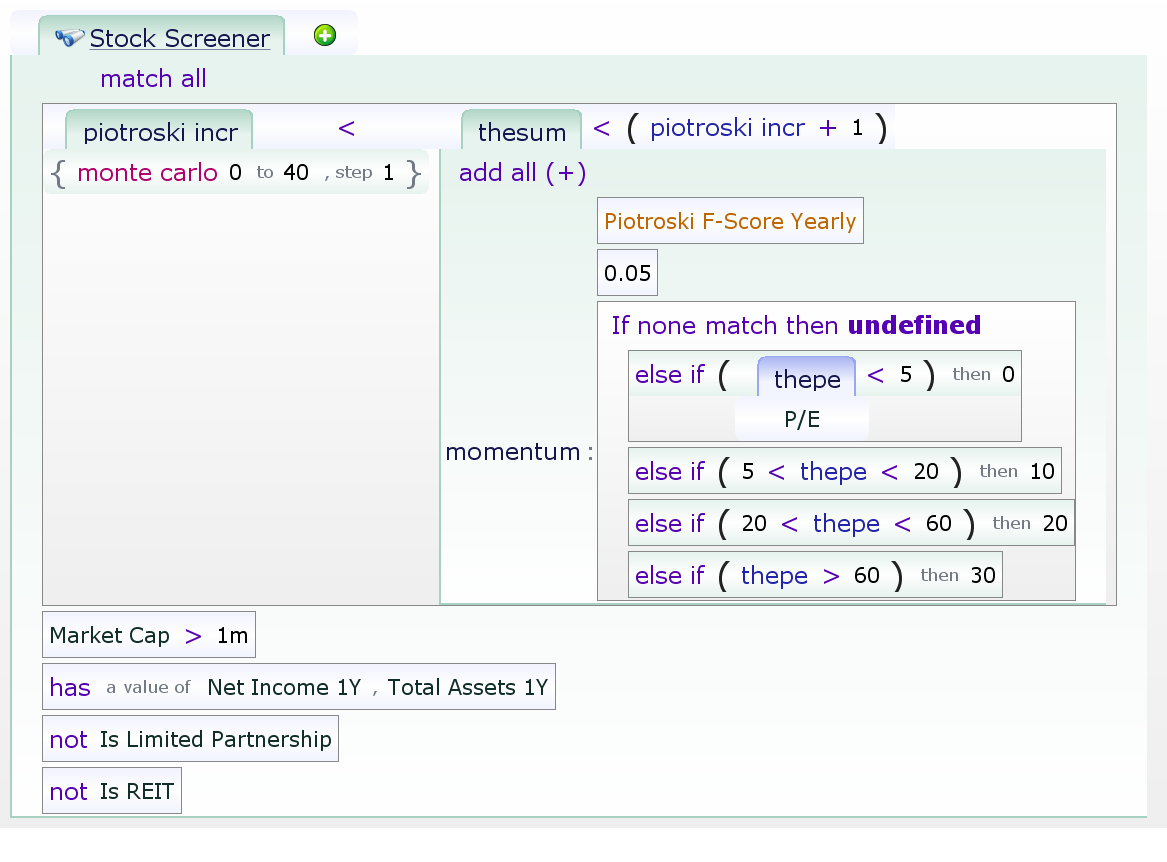
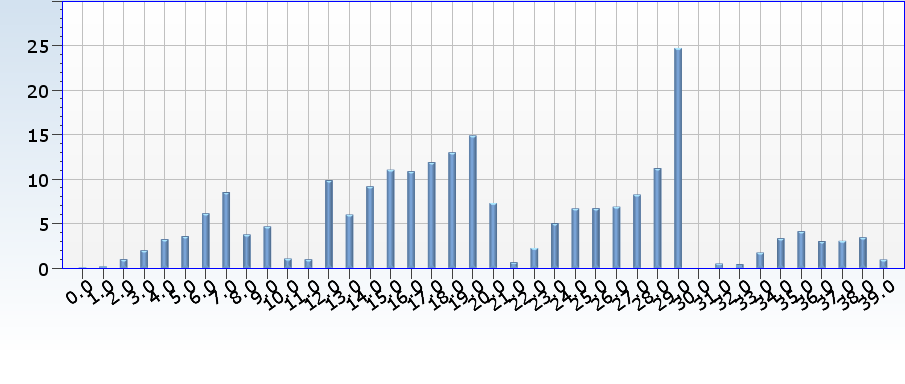
An attempt to fix this by weighting the current Piotroski twice as much means that the range goes from -10 to 20. It also makes it much more predictive of future returns.
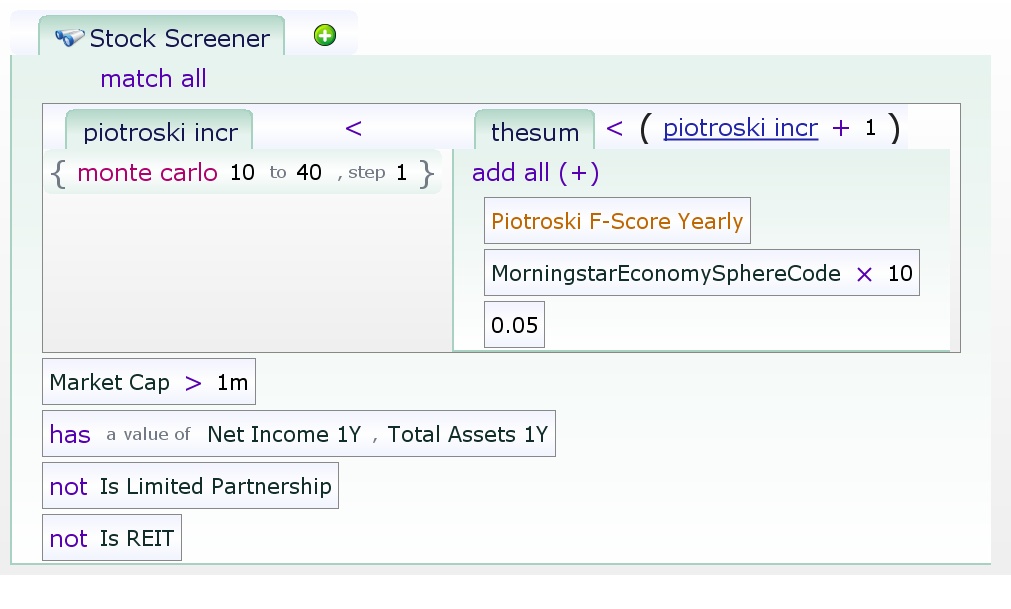
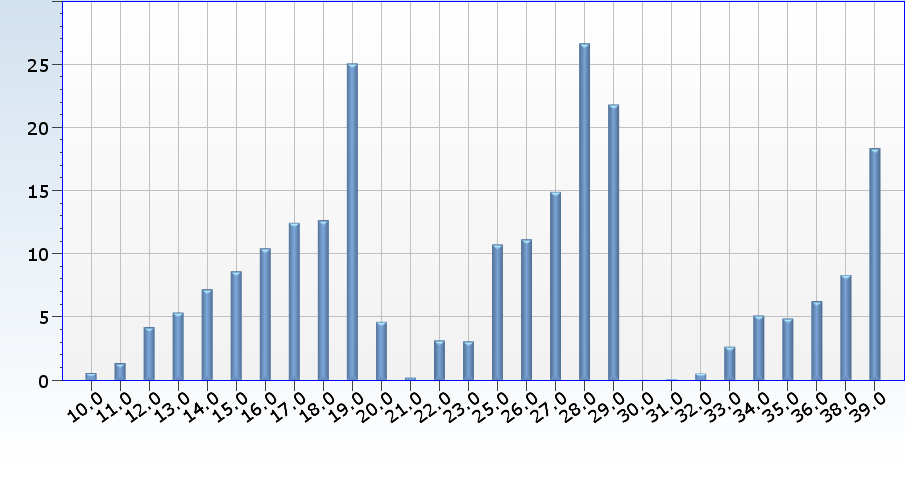
A final plot where the change is just a 1/10 modifier to the current score allows us to see how each Piotroski score behaves based on where it came from.
Aside from a few puzzling spikes, the closer both the current Piotroski and prior Piotroski are, the better the performance is, with a small increase being the best. Of course, the higher the score, the better.
Does the Piotroski score work with momentum?
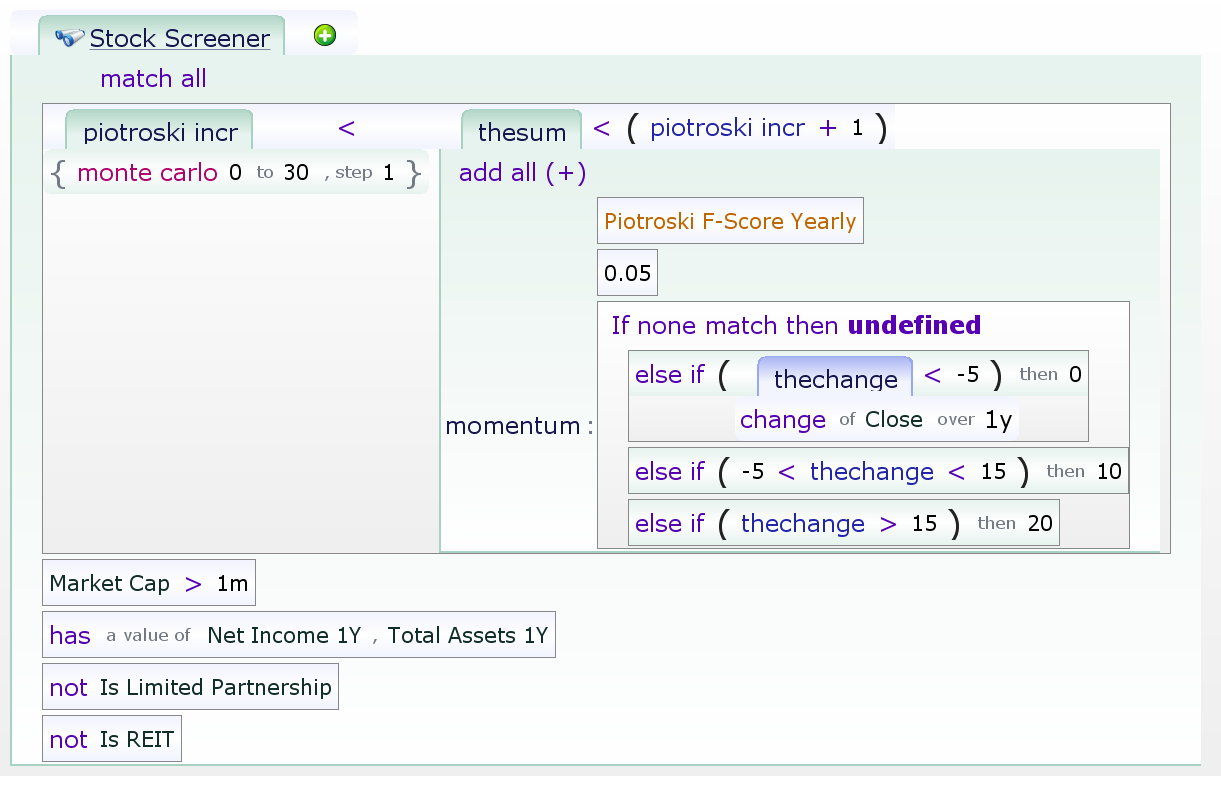
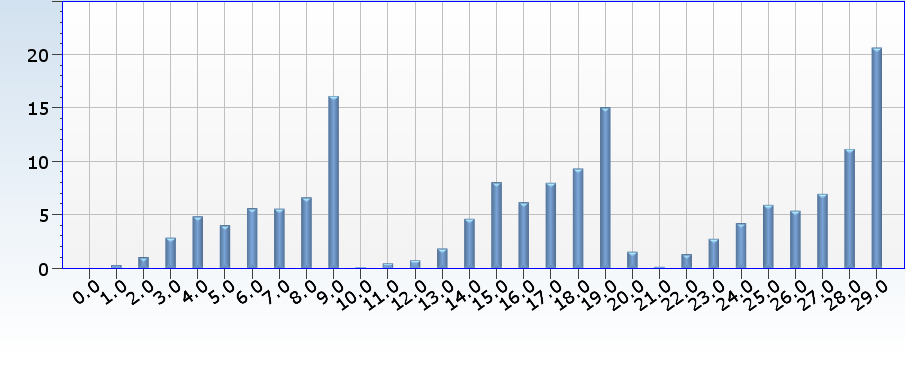
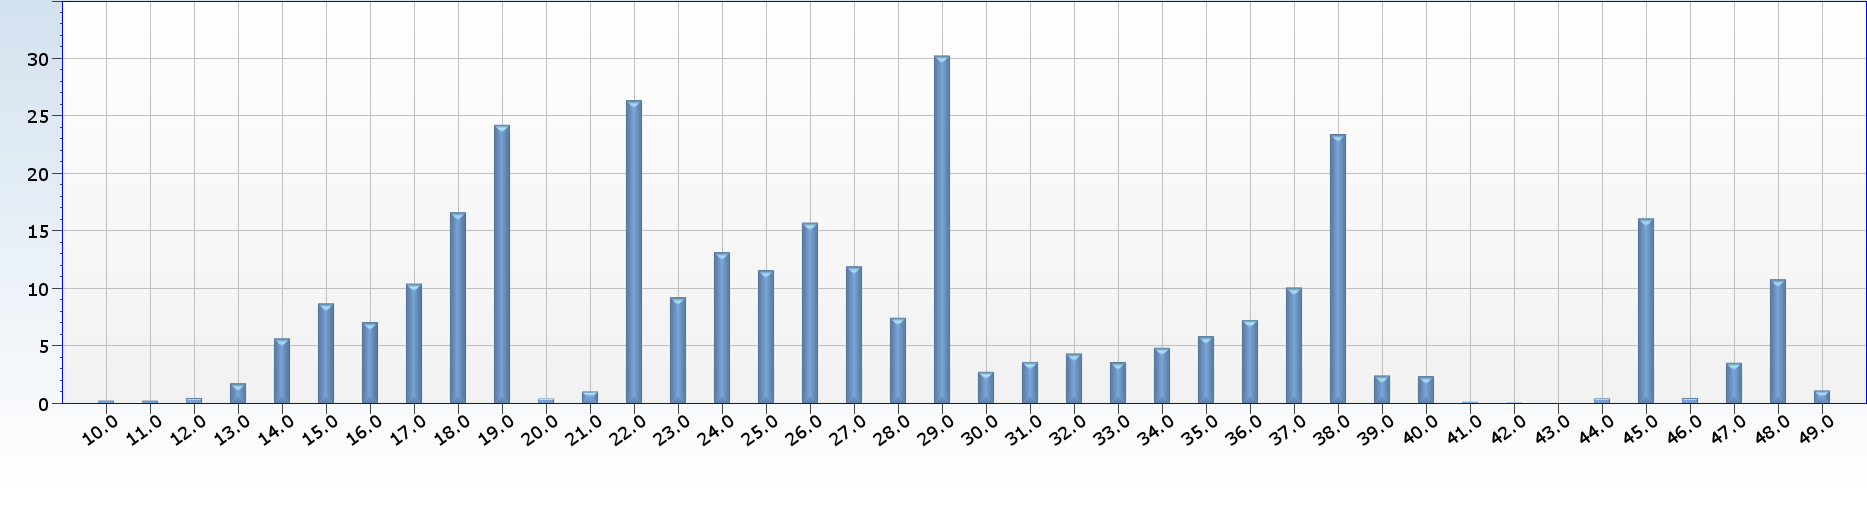
Momentum is past stock performance, which is also important in determining future stock prices. How do you separate performance by using the Piotroski F-Score and Momentum? Where yearly performance less than -5% gets 0 points, anything between -5% and 15% gets 10 points, and anything over 15% gets 20 points. Using high, medium, and low momentum, we split the Piotroski scores into three groups. Each ten items is a copy of the Piotroski score within that subset.
Apparently more momentum is better, but Piotroski works regardless.
Does the Piotroski score work with value?
Using the simplest interpretation of value (Price to earnings) and choosing four sets of values: under 5, 5 to 20, 20 to 60, and over 60, it seems that Piotroski works everywhere except when the P/E is over 60.
Does the Piotroski score work better in some sectors?
Morningstar breaks its equities down into sectors as follows:
- Cyclical
- Basic Materials
- Consumer Cyclical
- Financial Services
- Real Estate
- Defensive
- Consumer Defensive
- Health Care
- Utilities
- Sensitive
- Communication Services
- Energy
- Industrials
- Technology
Taking on the top-level divisions first, with this term:
Piotroski seems to work well with all three types of companies. For the defensive companies, firms with a Piotroski of zero seemed to do surprisingly well, but that’s the only thing of note other than that the zero Piotroski companies in the sensitive sector managed to lose more than 99% of their value. Ouch!
A summary of how well Piotroski did per sector is below. The concept of swap distance is used to describe how well each sector did. If the values were already in order, then no edits are needed. Otherwise, we count (approximately) how many swaps are required to put the values in order.
Cyclical
- Basic Materials – Worked well. The 0 Piotroski outperformed the 1, and the 5 outperformed the 6.
- Consumer Cyclical – A complete mess. The 2 and 9 had an insanely good performance, and the rest, other than 0 and 1, were mediocre. At least the 0 and 1 were terrible.
- Financial Services – OK. The 9 was bad, with values worse than 0 or 1. The 3 value was slightly worse than the 2 value. Other than that, all was well.
- Real Estate – A complete mess. Only the 5, 7, and 8 values made their investors any money, with all the other values having terrible performance.
Defensive
- Consumer Defensive – OK. The lower values were worse, but the 9 was terrible, and the 6 value was worse than 4 or 5. The general trend was intact, though.
- Health Care – Worked well. The 9 was less than the 8, and the 0 was better than the 1. The trend, though, was beautiful.
- Utilities – A partial mess. The lower values were generally lower, but the 4, 5, and 0 had too good of results, with the 4 and 5 being good, and the 0 being decent. The 9 was also bad.
Sensitive
- Communication Services – Good. The performance of the whole sector was ghastly, but the lower values were lower and the 9 was beautiful. The 5 was modestly bad.
- Energy – OK. The 8 and 9, while OK, weren’t better than the 6 and 7. The 0, 1 and 2 were all as horrible as one could want.
- Industrials – Perfect. The low values were terrible, and the high values great.
- Technology – Decent. The low values were terrible, with the 0 losing 97% and the 1 losing 100% (!) of the money invested. The values from 4 to 8 were all about the same, and 9 was slightly below that.
Does the Piotroski score work better in a bull or bear market?
We divide the market performance into segments:
- 0-9 – Each Piotroski score, only when the SPY has fallen more than 5% in the last year, not including dividends
- 10-19 – Each Piotroski, when SPY last year fell less than 5% or went up less than 5%, again excluding dividends
- 20-29 – each Piotroski for SPY yearly dividendless performance between 5% and 15%
- Each Piotroski when the SPY went up more than 15%
Then we test each Piotroski score in each segment, and we get the graph below. Studying it, we can see that middling Piotroski was better when the market had recently done badly, but all the higher Piotroskis are pretty good.
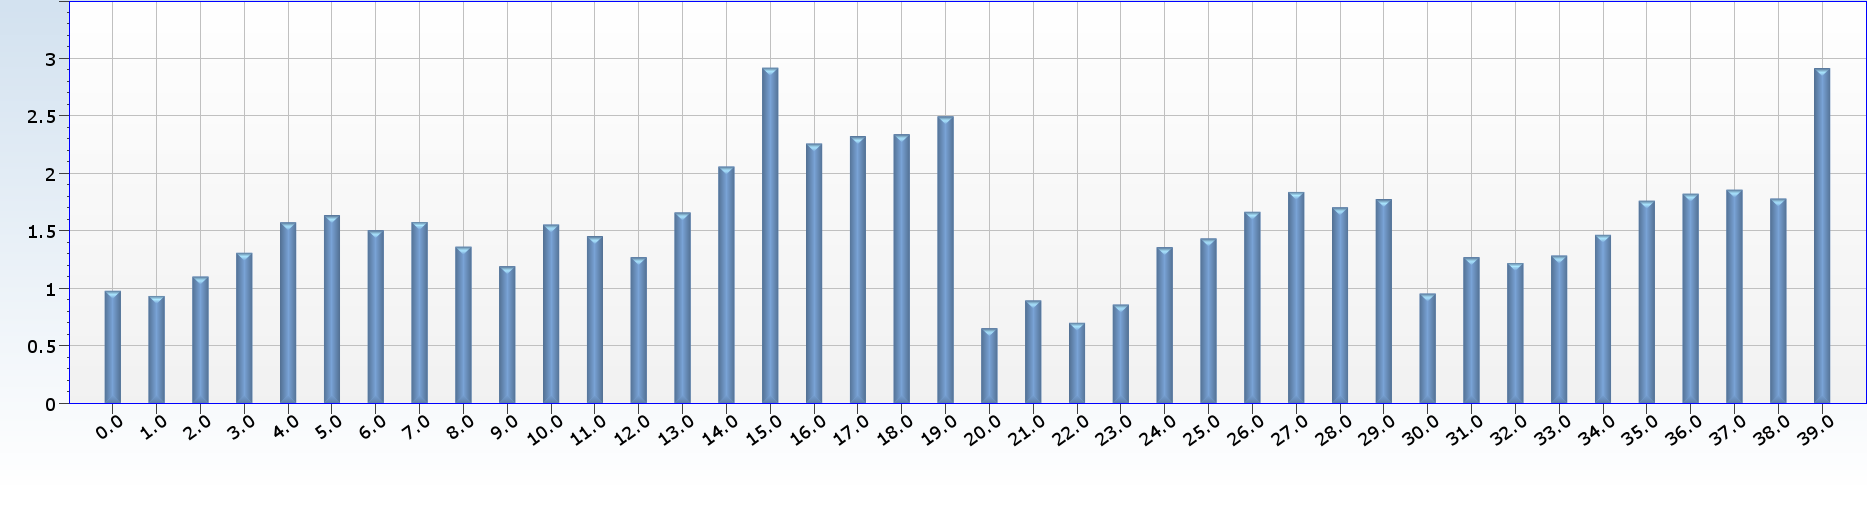
Note: you can’t use this chart to decide if certain markets are better or worse for stocks overall, as we don’t know how many market days are in each bar.
The Piotroski F-Score turns out to be a pretty good scorer. In order to use it for maximum effectiveness, it can be used alongside other scorers such as momentum, market performance, sectors, and stock performance. The score is very robust when used in a wide variety of situations. So, get out and Piotroski!