Overview
Crafting Strategies
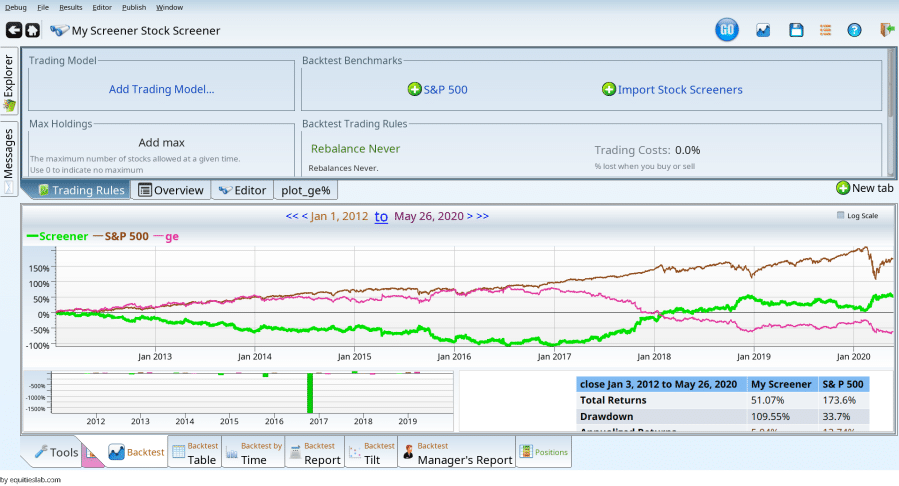
Backtesting
UI Features
Common Models
Creating long short portfolios
Creating Long Short Portfolios in Equities Lab
Shorting stocks is hard to do profitably. Very hard. That said, adding a short component to portfolios can reduce drawdown. Long/Short portfolios are also useful to see if factors are important for good investment performance.
Using the islongshort macro
To model a long/short portfolio with maximum control, use the islongshort macro. To do this, from an empty stock screener, type “import islongshort” and hit return.
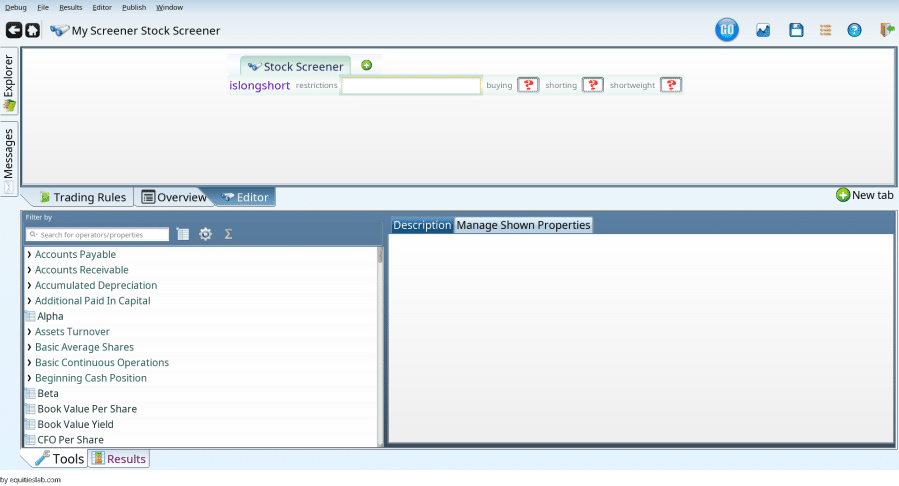
The five blanks can be filled in as follows:
- Restrictions — this will contain the set of stocks you want to consider at all. Stocks that don’t match this will not show up in the portfolio, either long or short. This is a good way to ensure all your choices are reasonable.
- Buying – this will be the stocks you want to buy, because they will go up — you hope
- Shorting – this defines the stocks you think/hope will go down
- Weight – The weight you want to give the short side of your portfolio. 1 is a very good default, but 0.5 will model a portfolio that is two thirds long, one third short. 2 will model a portfolio that is one third long, two thirds short.
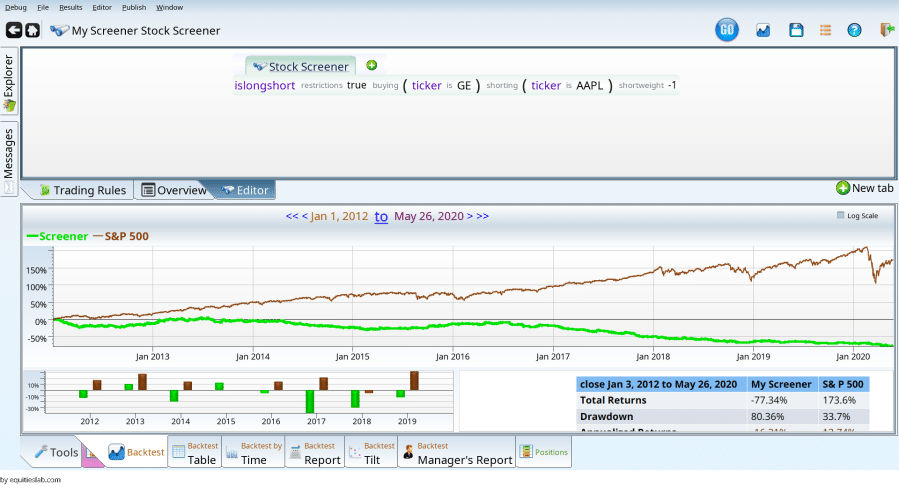
To create a trivial example, we create a long/short strategy where we buy GE and short AAPL.
Shorting AAPL and Buying GE
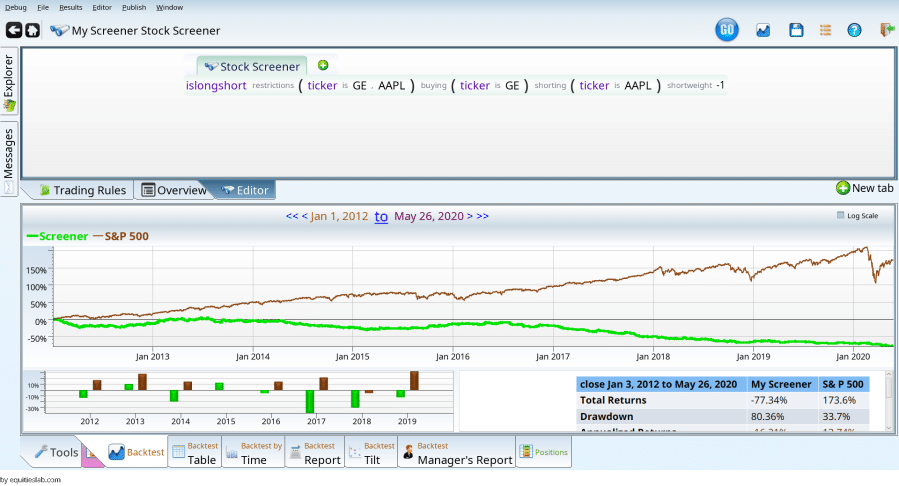
That’s obviously not a winning strategy. We can remove things from the first term to see where the performance comes from.
Getting rid of GE made the performance worse! How is that? GE had negative performance for the time period. The answer is simple: the first screen was a mix of 50% shorting AAPL and 50% buying GE, while the second screen went all in on shorting AAPL. Clearly shorting AAPL is worse.
What happens if the first blank is just filled in with true? This will allow the screener to pick from the whole universe of stocks. Which won’t make much difference as it only has two stocks on its mind. If it were going to pick more stocks on the long or short side, then this would matter more.
It gives us the same as the GE/AAPL case. Stocks that aren’t bought or shorted are just thrown out.
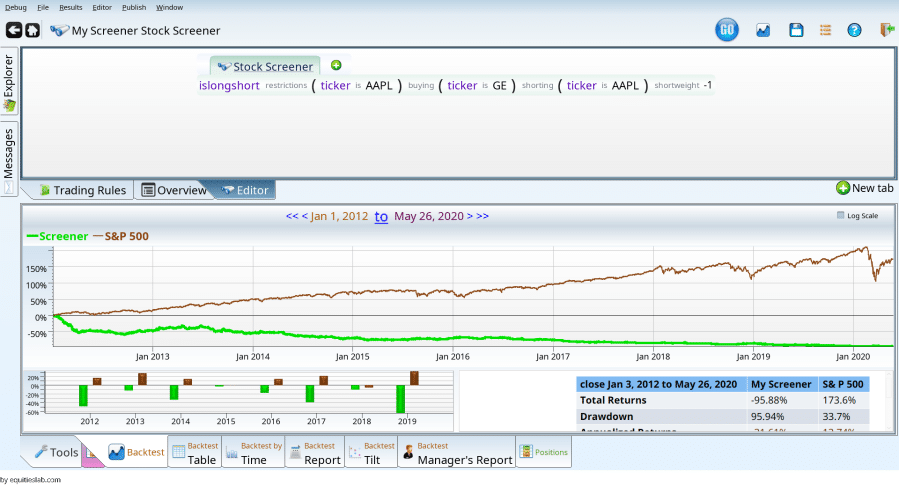
Doing it “right” by shorting GE and buying AAPL
This is rampant future prediction. It would have been impossible to know that AAPL would crush all expectations, and GE would do horribly. That said, here it is.
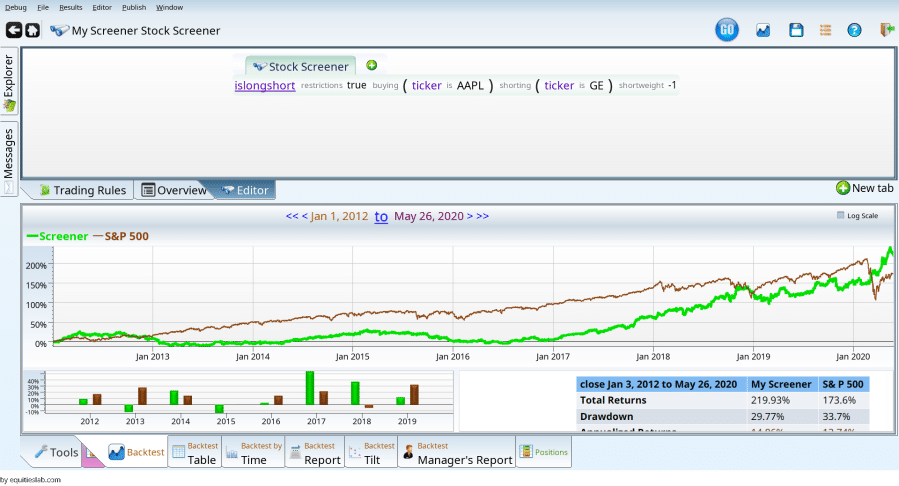
That is certainly less amazing than expected. Turning off the GE, it is apparent that the shorting is the problem. Selecting GE, and hitting Ctrl-D will disable just the GE, putting a gray box around it. With no other terms in the ticker is, the term will never be true, and our short side will never happen.
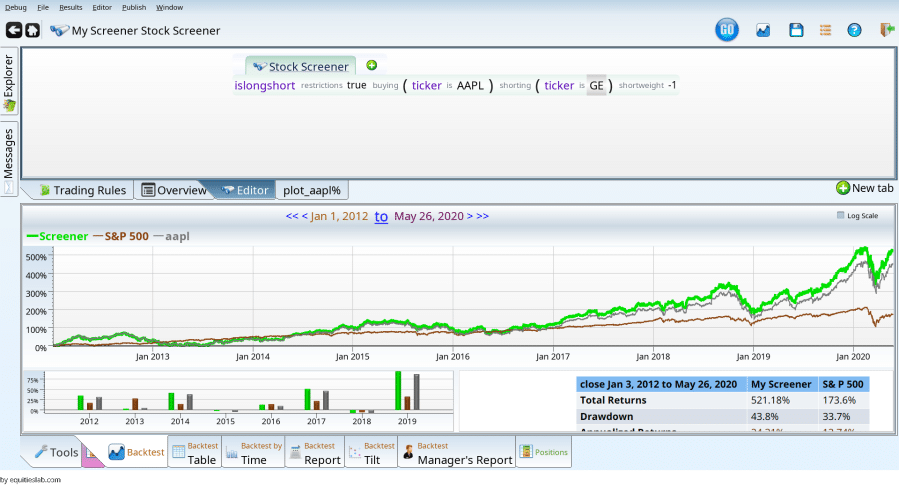
The performance looks a lot like AAPL, with the grey line indicating AAPL without dividends. Disabling AAPL instead of GE yields a puzzling graph.
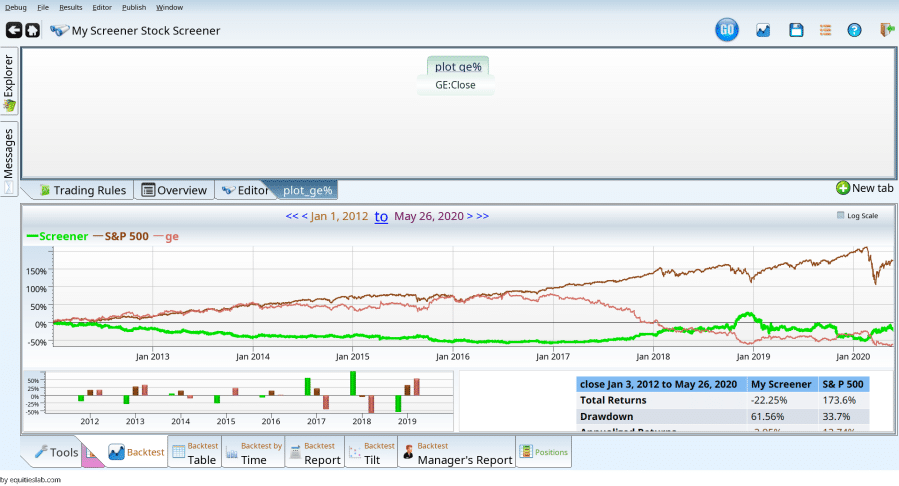
It is apparent that the green line and the pink line go in opposite directions, but the result is still a loss for investors holding GE, and a loss for investors shorting GE, rebalancing quarterly. Puzzling. Changing the rebalance to Never indicates that the culprit is in the rebalance.