
Overview
Crafting Strategies
Backtesting
UI Features
Common Models
Changing the Benchmark
Equities Lab
Learn how to benchmark your strategy versus various benchmarks, ranging from indexes, to stocks and other strategies.
Imagine you have a large cap screen
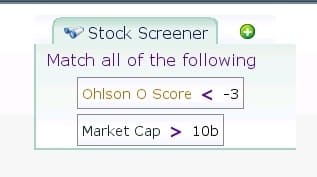
Cutting to the chase, imagine you have a simple screen that finds reasonable large cap companies. That screen is literally “import ohlson_o_score < -3 and mc > 10b”
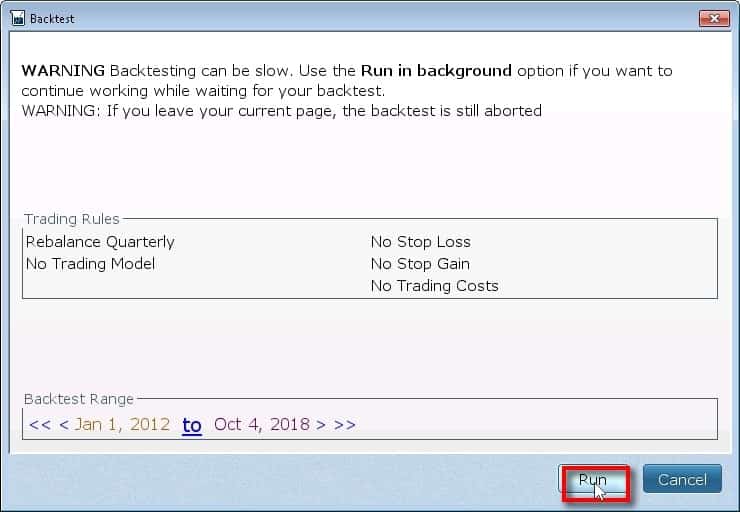
Click on “® B 9”
” src=”https://www.equitieslab.com/wp-content/uploads/2018/10/e59du_2.jpg” />
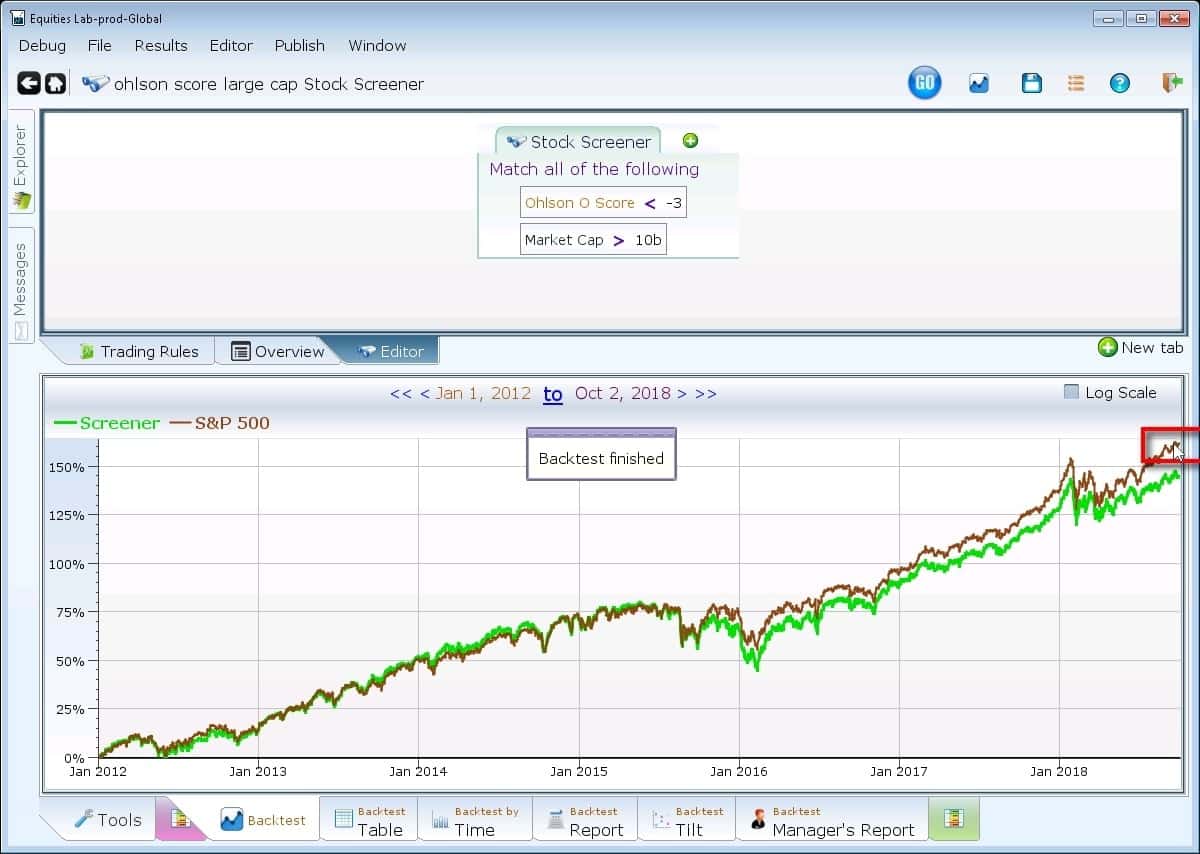
Click on “I Trading Rules”
” src=”https://www.equitieslab.com/wp-content/uploads/2018/10/e59du_5.jpg” />
Click on “S&P 500”
” src=”https://www.equitieslab.com/wp-content/uploads/2018/10/e59du_6.jpg” />
Add AAPL for a tough benchmark.
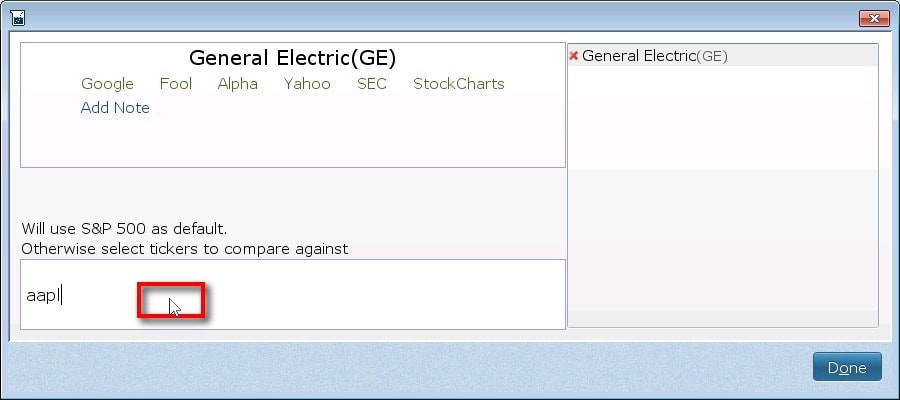
Hard to beat Apple! Notice we added General Electric. It’s hard NOT to beat General Electric.
When you type in RUI it fails.
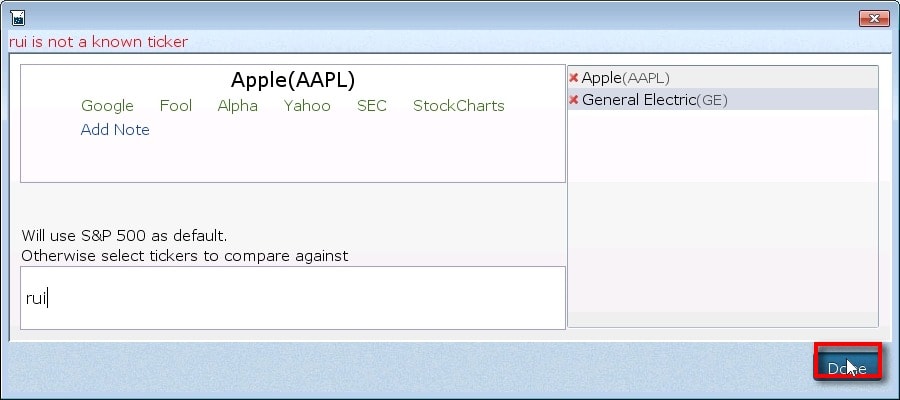
We don’t have the adjusted close of the Russell 1000 in our system. Or do we?
See GE and AAPL as benchmarks, but no Russell 2000.
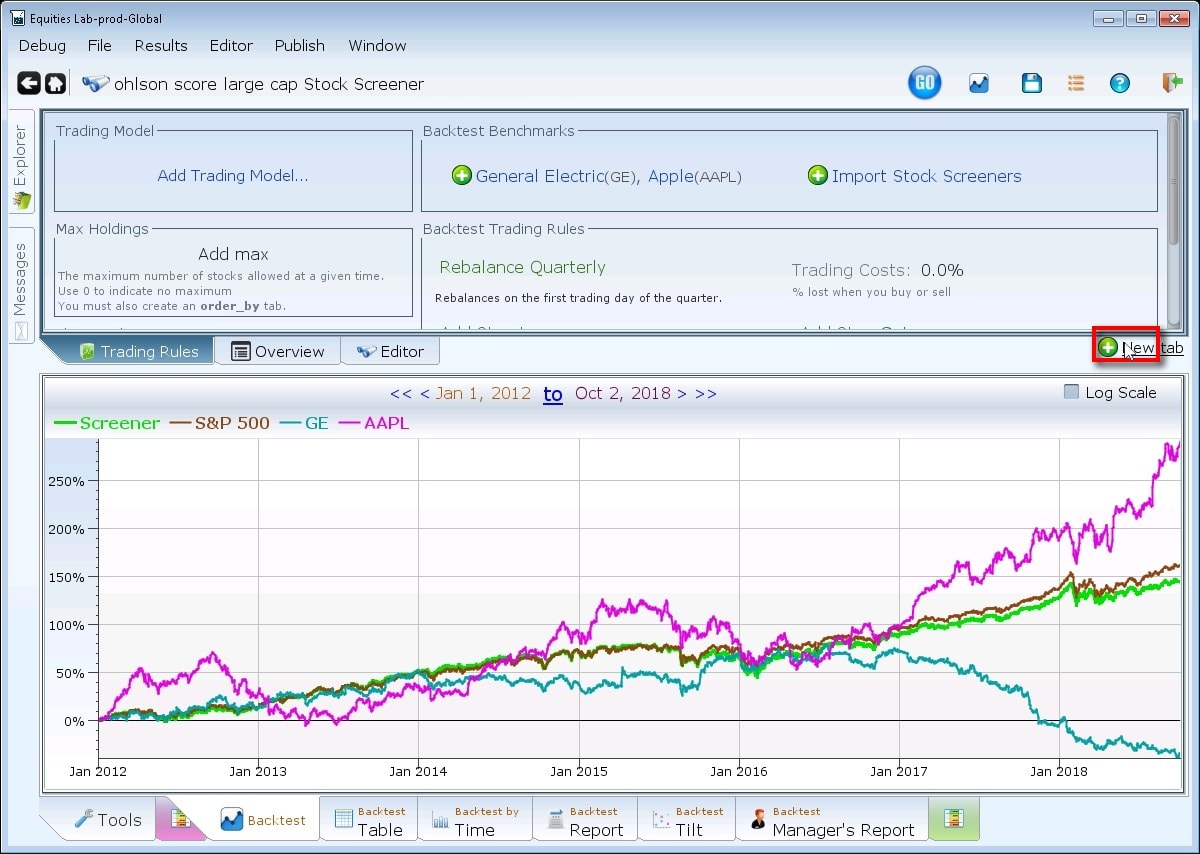
We’re going to go to quandl to get this data. So first, we’ll click on new tab.
We have to call our variable something
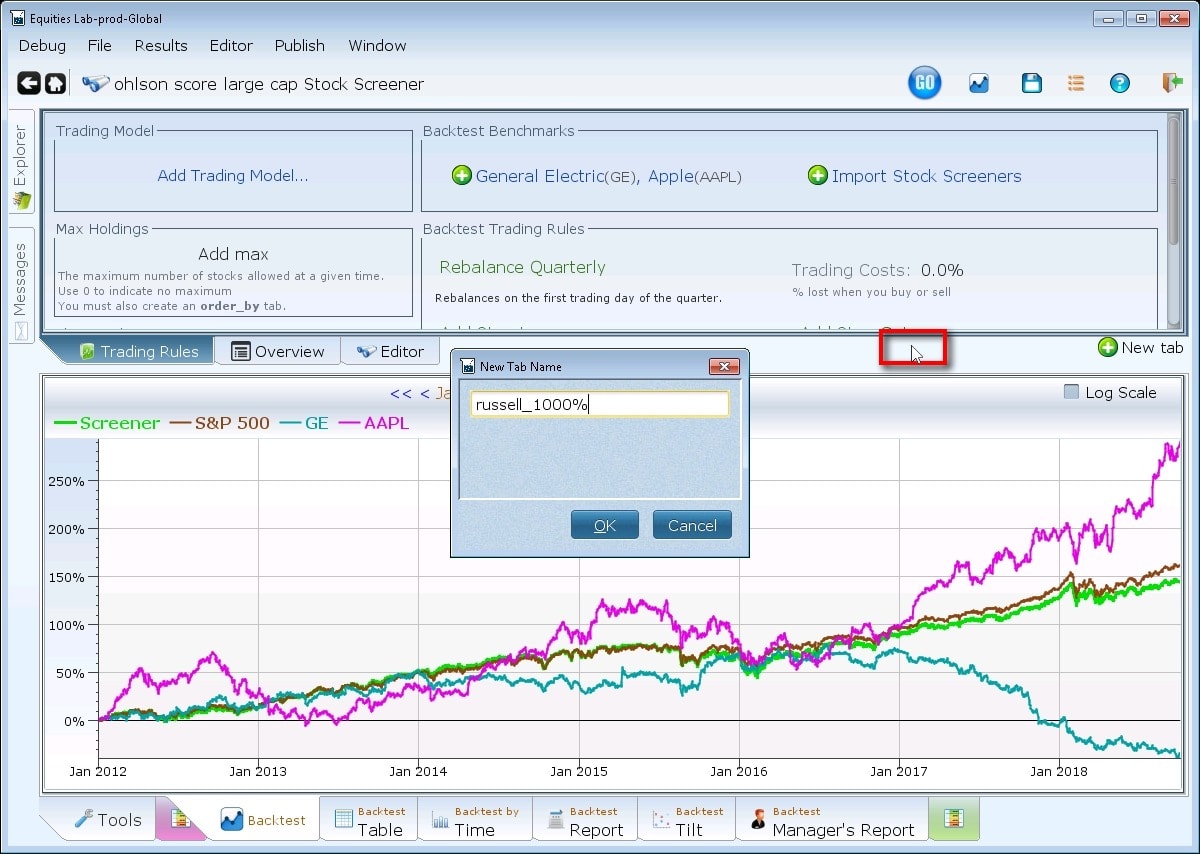
Type in: russell_1000%. The percent at the end ensures that it is plotted as a benchmark (i.e. on the same scale as the green and brown lines.
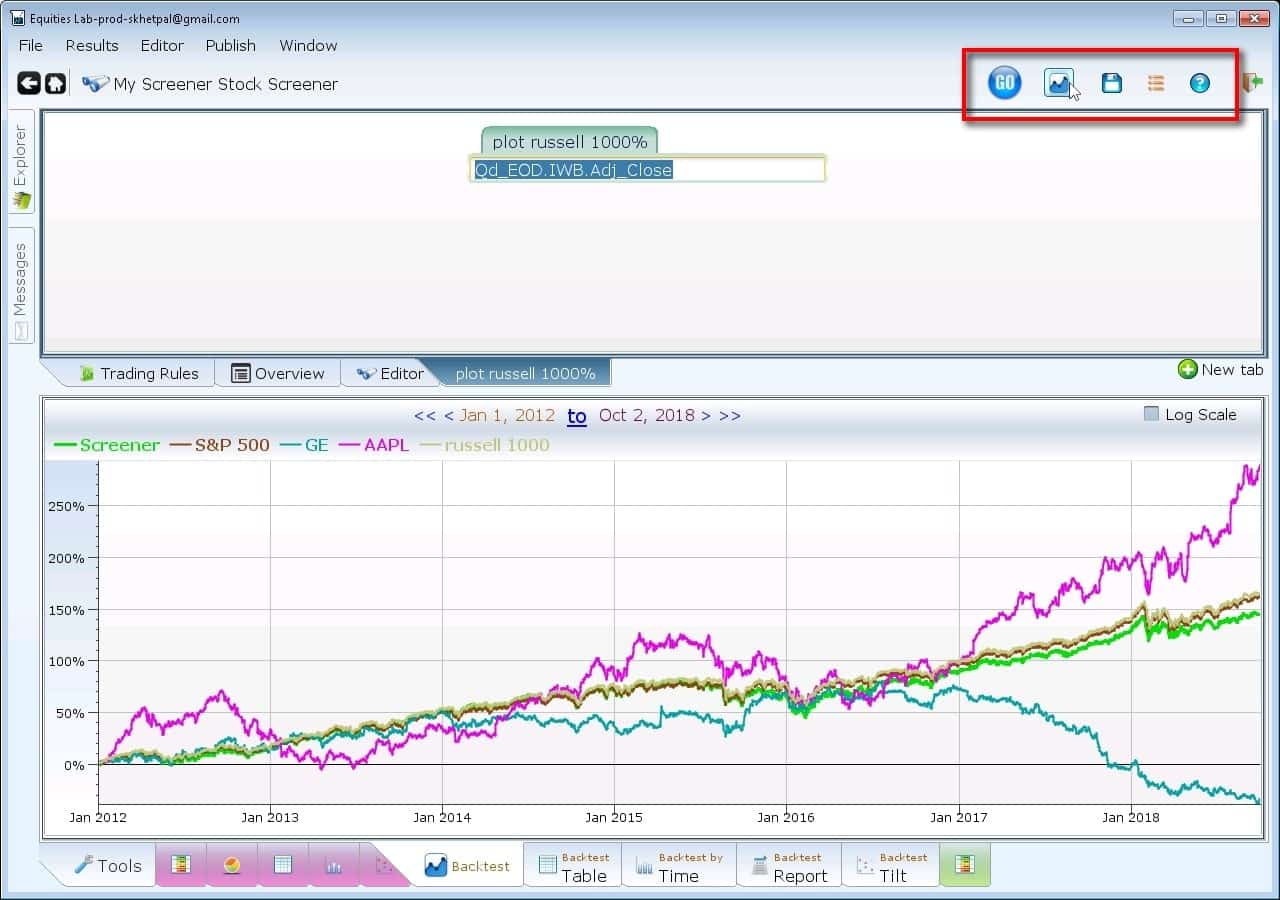
Click on “plot russell IOOOO/o”
” src=”https://www.equitieslab.com/wp-content/uploads/2018/10/e59du_11.jpg” />
Click on “plot russell IOOOO/o”
” src=”https://www.equitieslab.com/wp-content/uploads/2018/10/e59du_12.jpg” />
Use Quandl to get your data
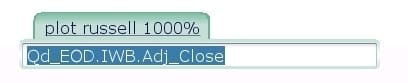
You can cut and paste any public permalink from Quandl into Equities Lab, but in this case, EOD data is what you want. So, type in “Qd_EOD.ticker.Adj_Close” where ticker is the ticker you want to follow. IWB happens to be a Russell 1000 index fund.
Backtest your screen again
The new results are a click away.
Check out the backtest report
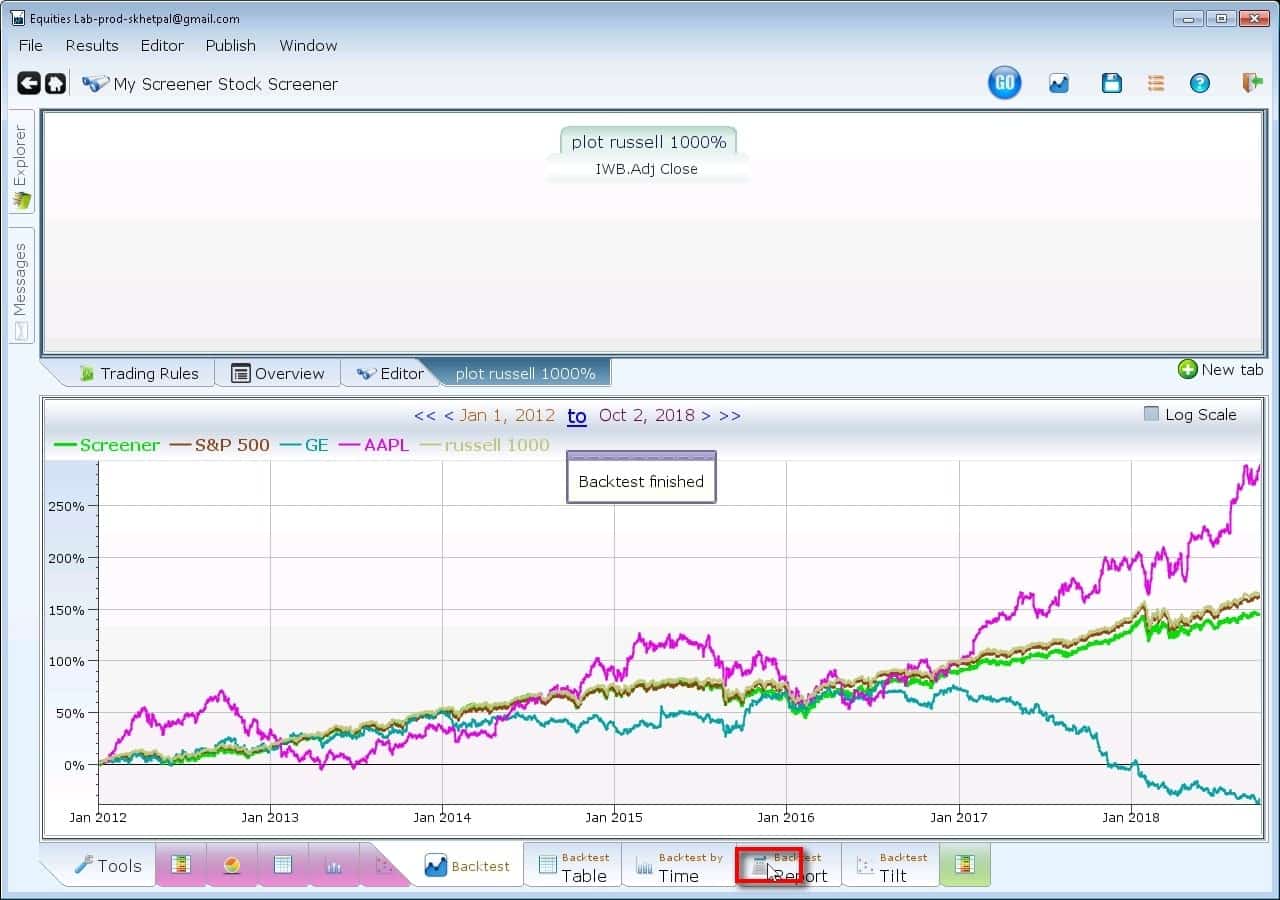
The line looks pretty similar. But if numbers are desired, check out the backtest report.
Bonus: Use another screen as benchmark
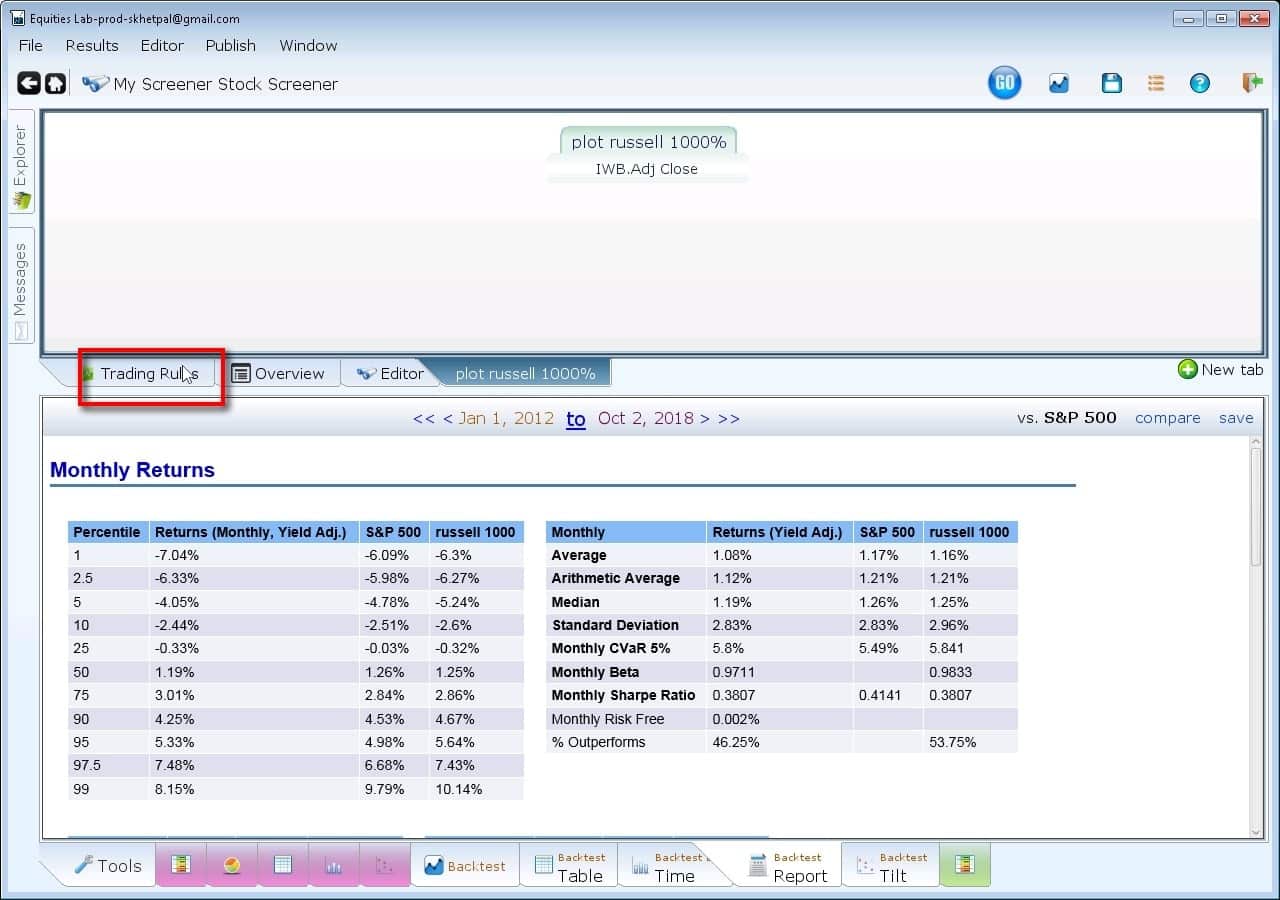
Click on trading rules, to add it.
Click on “Import Stock Screeners”
This will show another backtest as a benchmark.” src=”https://www.equitieslab.com/wp-content/uploads/2018/10/e59du_17.jpg” />
This will show another backtest as a benchmark.
Observe how badly “Large company” did versus the other benchmark
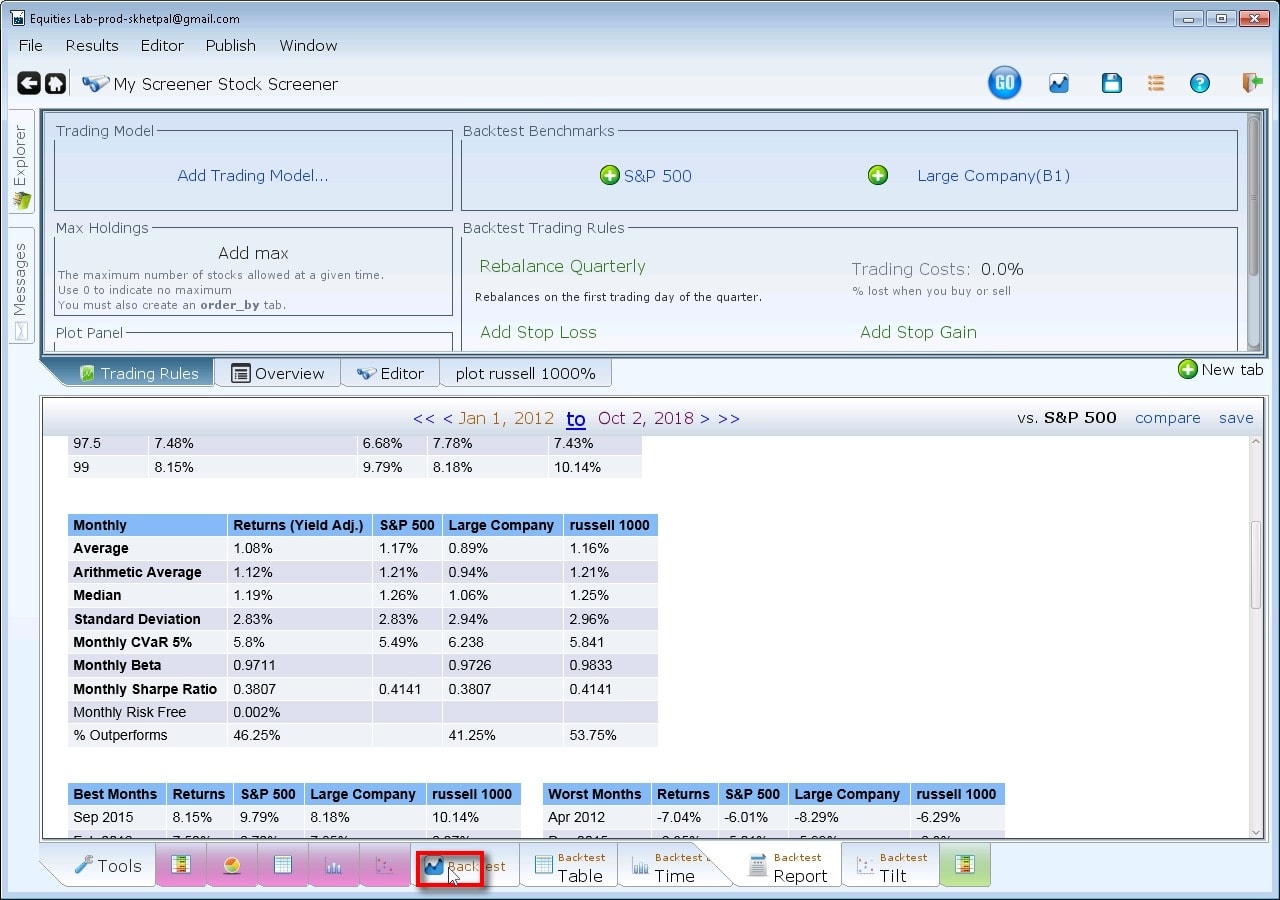
Large company (all companies over 10b in market cap) clearly did not do as well as our screen or the other benchmarks, so clearly all the benchmarks are doing something to outperform it.