
Overview
Crafting Strategies
Backtesting
UI Features
Common Models
Creating Your Own Score
Construct your very own score
Most anytime we analyze a company or build a screen; we use a number of scores that are pre-built in the Equities Lab system. These scores are tried and tested, but they lack that personal touch. I think it’s time we learned how to build our own scores within the software.
To begin creating your score, you need to open up your explorer and click “Formula” under the Create New area. Go ahead and name your formula anything you like, but you’ll want it to be something regular that you can remember.
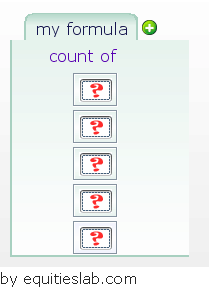
At its core, a score is a collection of True/False variables. This set of 1s (True) and 0s (False) is added together to create the final score. Set this up in your editor by typing “count of” on the open line. Once you set count as your operator press “;” a few times until you have the number of spaces you need for your score.
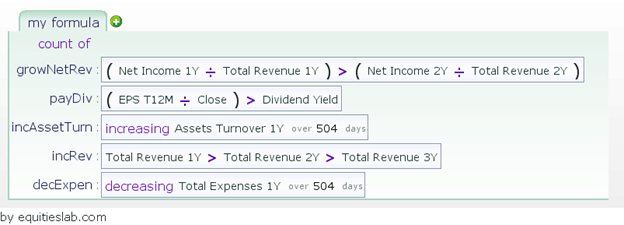
When building a formula, I highly suggest making each line a variable. This will allow you to more quickly identify what’s going on in the formula and make it easier to tweak as time goes on. The formula above is an incredibly short earnings score that I threw together to demo this feature.
You can put anything you like on each line. If you’re at a loss for what to input, you can drag and drop a property from the bottom of the Equities Lab page. We have almost 10,000 different operators and properties to choose from, so at least one will fit your investment philosophy.
It’s now time to implement your formula into a screener and see how well it fares against the benchmark.
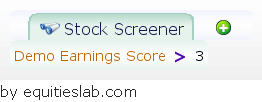
Once you create your screener, go to the editor and type the following –
- Import “the name of your score”
Your score should show up in the drop-down list. Just select it and set how high of a score a company needs to get into your portfolio. In my case, I wanted to find all of the companies who had a Demo Earnings Score of 4 or 5.
I can add other things to the screener as well:
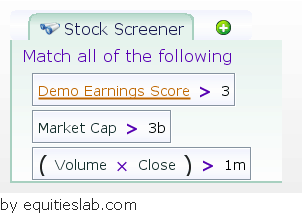
There are certain things you want all companies to have, regardless of their score. In the case of my screen here, each company I invest in must have an earnings score above 3, be worth at least $3 billion, and trade an average of $1mm worth of shares in a day.
Are there any matches? If your screen is only showing you two or three companies, you may have your parameters a little too tight. Loosen them up so you can capture at least 15 different prospects for you to analyze further.
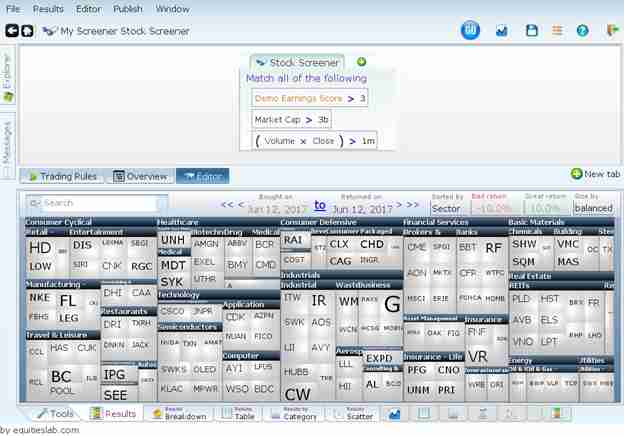
For my screen, I receive a total of 134 companies back. Usually, this would be a bit too many, and I would tighten my parameters, but since we are just creating this formula to walk through the process, I think it’s okay.
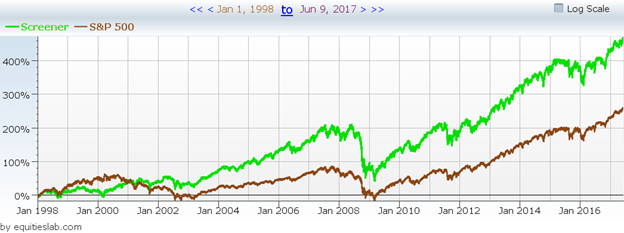
Running the backtest over the past 19 years we can see that the cart is moving in the right direction.
That said, there are a few concerning things (and the reason why you never really stop tweaking and building your formulas).
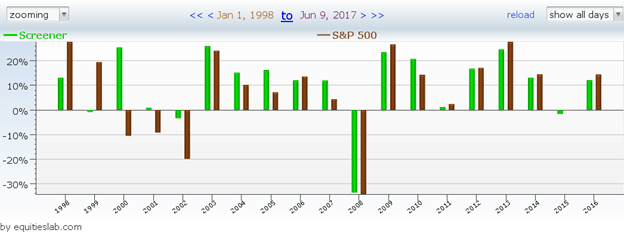
The primary concern I have passed the sheer number of companies is the fact that this screen hasn’t beaten they benchmark since 2010. I show this because you need to remember to validate your scores just like your screens before you jump in head first and invest solely based on past returns.
At the end of the day, scores are one of the most used features within the Equities Lab system because they help you quantify a bunch of parameters into one simple number that can be used again and again. Scores are powerful and just might change your investment analysis process for the better.