
Overview
Crafting Strategies
Backtesting
UI Features
Common Models
When to Use Compare Close or EPS to a Number
A lesson on absolute prices versus relative ones
You clicked on this article to understand how to compare close to a number. We are here to tell you that “You can’t (or shouldn’t) use Close > 5.00” in a stock screener.
Here is why:
Imagine you look at a share of “GoodStock” (this is a fake stock, for our example); it goes up and up and up! If it follows the example of Berkshire Hathaway, and soon it sports a 5 or 6-digit closing price, and people can’t buy the stock. Due to the high closing price, it splits and splits again. On the other hand, “BadStock” starts at $10, and soon enough, it has a price of less than a dollar. So, it does a reverse split, gets its closing price up to $10, and continues life.
So what does this mean for us? You should not compare per-share quantities (Close, Open, High, Low, Volume, EPS, Sales_per_share, etc versus constants. Close > Close as of 200 days ago is fine, but Close > 10 is not. Similarly, Close > Open is fine (they both have this history element included).
What should I do?
The answer to this problem is to convert Close to RawClose, Open to RawOpen, or swap out your constant for something that factors the splits out. Here are some example problems and how you can fix them:
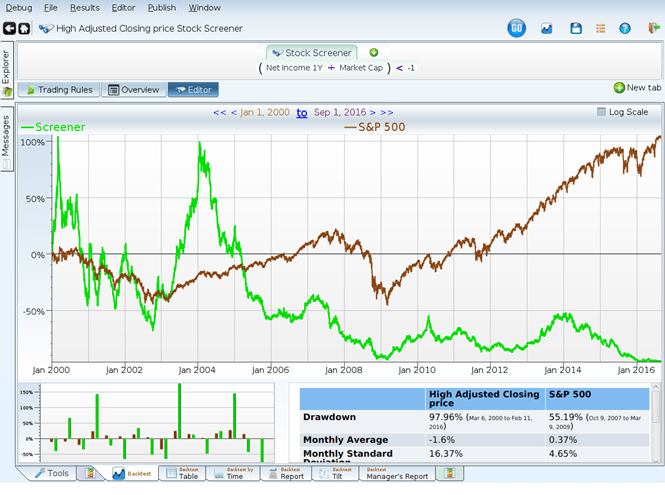
High prices stocks are terrible!
When “Close > 444” is typed into a stock screener, you are presented with the best short screen ever!
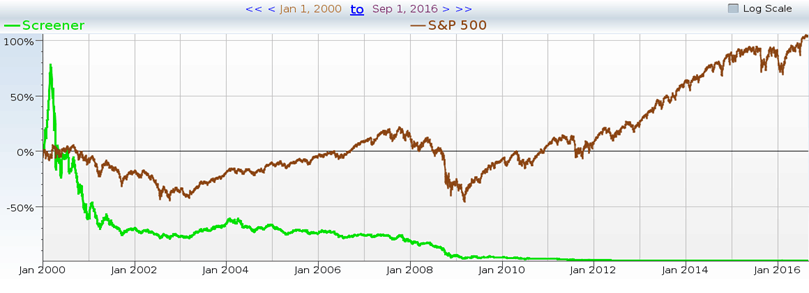
All the biotechs that reverse split repeatedly help push this down to new lows. Unless you are psychic and can predict reverse splits and FDA failures, I wouldn’t try shorting this screen.
(Now, instead of this working and giving you false hope, the system will return an error stating that you cannot compare split-adjusted quantities. To remedy this problem, follow the steps in this article.)
If you swap the Close for RawClose (RawClose > 444), you get this:
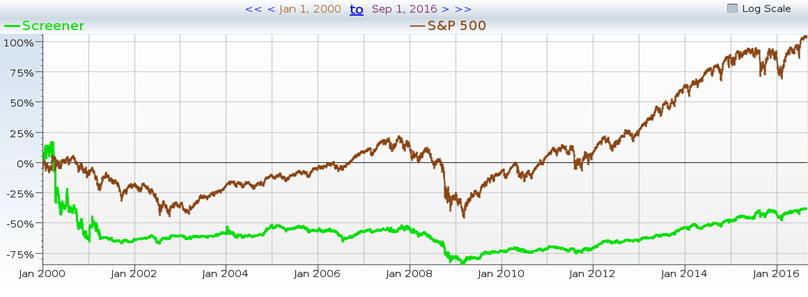
Which is still nothing to write home about.
I want to get rid of penny stocks!
The next case that comes up is with the natural urge to eliminate illiquid penny stocks. Here you have the opposite problem; it looks like penny stocks sometimes outperform. What can you do?
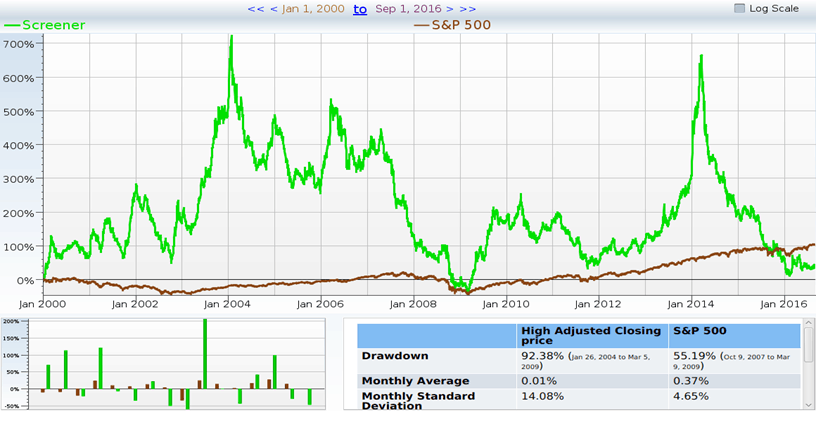
The obvious “Jam the Radar” solution is to use RawClose again. That does nothing for illiquid stocks, though. So we use “Close * Volume > 200k” instead. Why does this work? It works because volume goes down with reverse splits, even as the price goes up. The two effects cancel. Heck, why choose? Use both!
Large negative earnings
Sometimes a picture is worth a thousand words. Unfortunately, EPS is also split-adjusted, so we again are being psychic without meaning to.
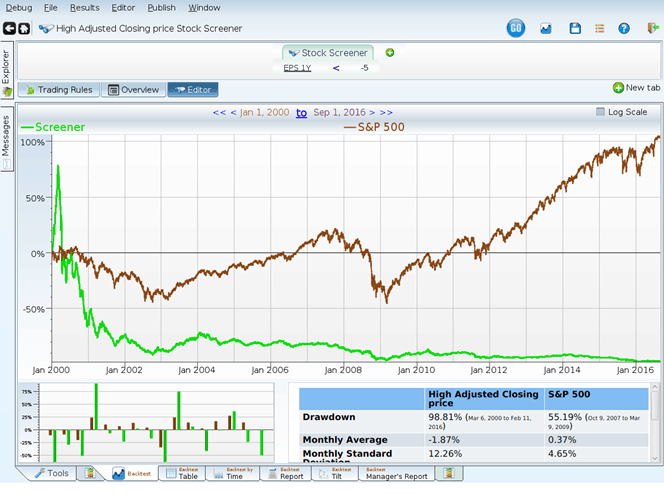
We solve this by looking for companies with high negative PE values (we have to compute them manually since the built-in PE excludes money-losing companies.
This may be the beginning of a good short strategy!