Equities Lab
Features Articles Help Account
Free Trial
Overview

Charting Tool

FAQ

Six Steps to Validate a Stock Screen

Crafting Strategies

Filtering and Ranking

When to Use Compare Close or EPS to a Number

Using Rank Across

What is a Red Flag in Finance?

FRED Properties

What is the Piotroski F-Score?

Putting Piotroski to the Test

Relative Strength Indicator (RSI)

The Investable Universe

Undefined Property Handling

Backtesting

Backtest Rebalancing

Can’t Compare Split Adjusted Prices

Changing the Benchmark

Creating long short portfolios

Creating Your Own Score

How do delisted stocks affect your portfolio?

Learning about Green Flags and the Green Flag Score

Factor Analysis

Monte Carlo Simulation – Advanced Investing

Ohlson O-Score

Being too selective with your screener

Simulating a Short Strategy

Survivorship Bias – How does it work?

Tear Sheet – How To Create (2024 Update)

How To Use Monte Carlo With The Piotroski Score

Dynamic metric averages

Why does past rank ever change?

UI Features

Charting Individual Stocks

How the screener works

Watchlists

Importing formulas

Press release — We’ve integrated with Tradier!

Run Backtests in the Background with Recent Backtests

Stock Analysis – Creating a Tear Sheet

Utilizing Plot Panels

A Charting Tool

Why is the P/E Line Broken

Common Models

Supposedly Boring Dividend Screener – New Featured Screen

CAPM – Capital Asset Pricing Model

How to Screen for Covered Calls

Low volatility with good returns

Financial Valuation: Gordon Growth Model

O’Shaughnessy Tiny Titans Screen

How does the S&P criteria work?

Value Across Time YRLY – New Featured Screen

Tiny Titans Stock Screener: History, Performance, and Refinements

Factor Analysis

Factor backtesting and analysis

Factor backtesting in Equities Lab is easy, and revealing.  Here we analyze the factor total assets / sales, chosen at random because it is late at night when I wrote this article:-).

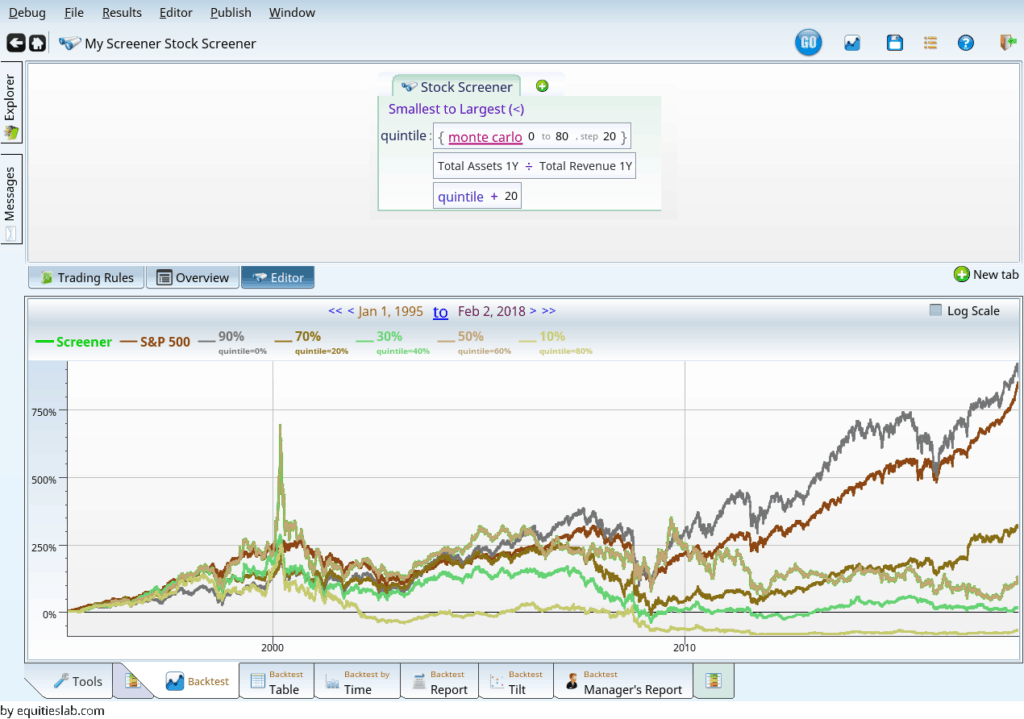
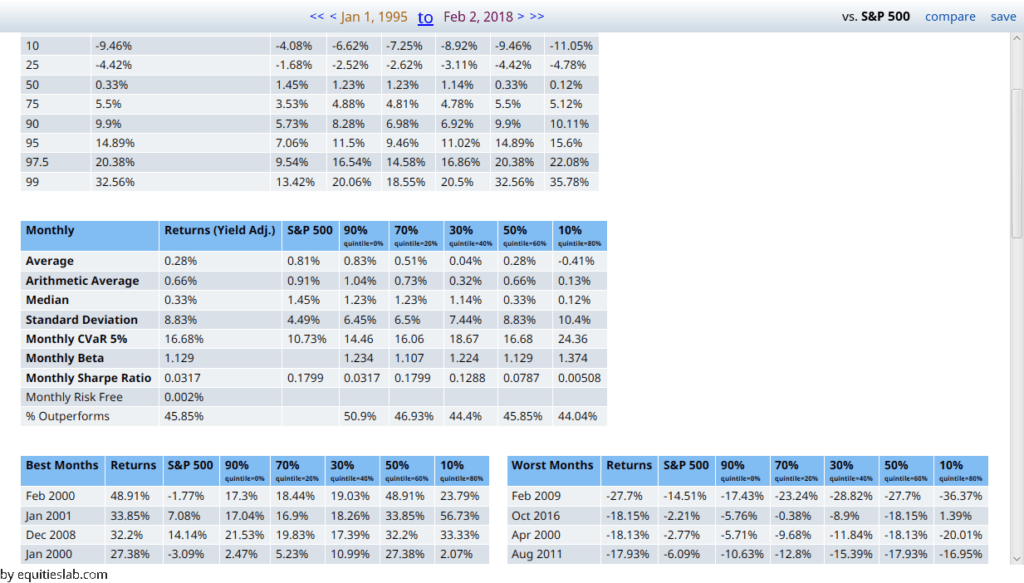
We see that fewer assets are better:  the two best performing quintiles are the lowest ones.  If you like numbers better than pretty lines, there are a few below — detailing the performance of each quintile.  If you could scroll the scroll bar you could see the yearly performance, but since this is an email, that won’t work…

We have other displays, to dig into the data more, and when you aren’t doing analysis of five backtests at once, you can see the positions taken by each one, so I suspect we can help you out.  We use Morningstar data, which goes back to 1995, and we are survivorship bias free, covering US equities.

contact sales@equitieslab.com