
Overview
Crafting Strategies
Backtesting
UI Features
Common Models
Watchlists
How to Use a Watchlist
by Henry Crutcher
A brief intro to get more out of watchlists, which will help you to manage your holdings.
Visit a watchlist
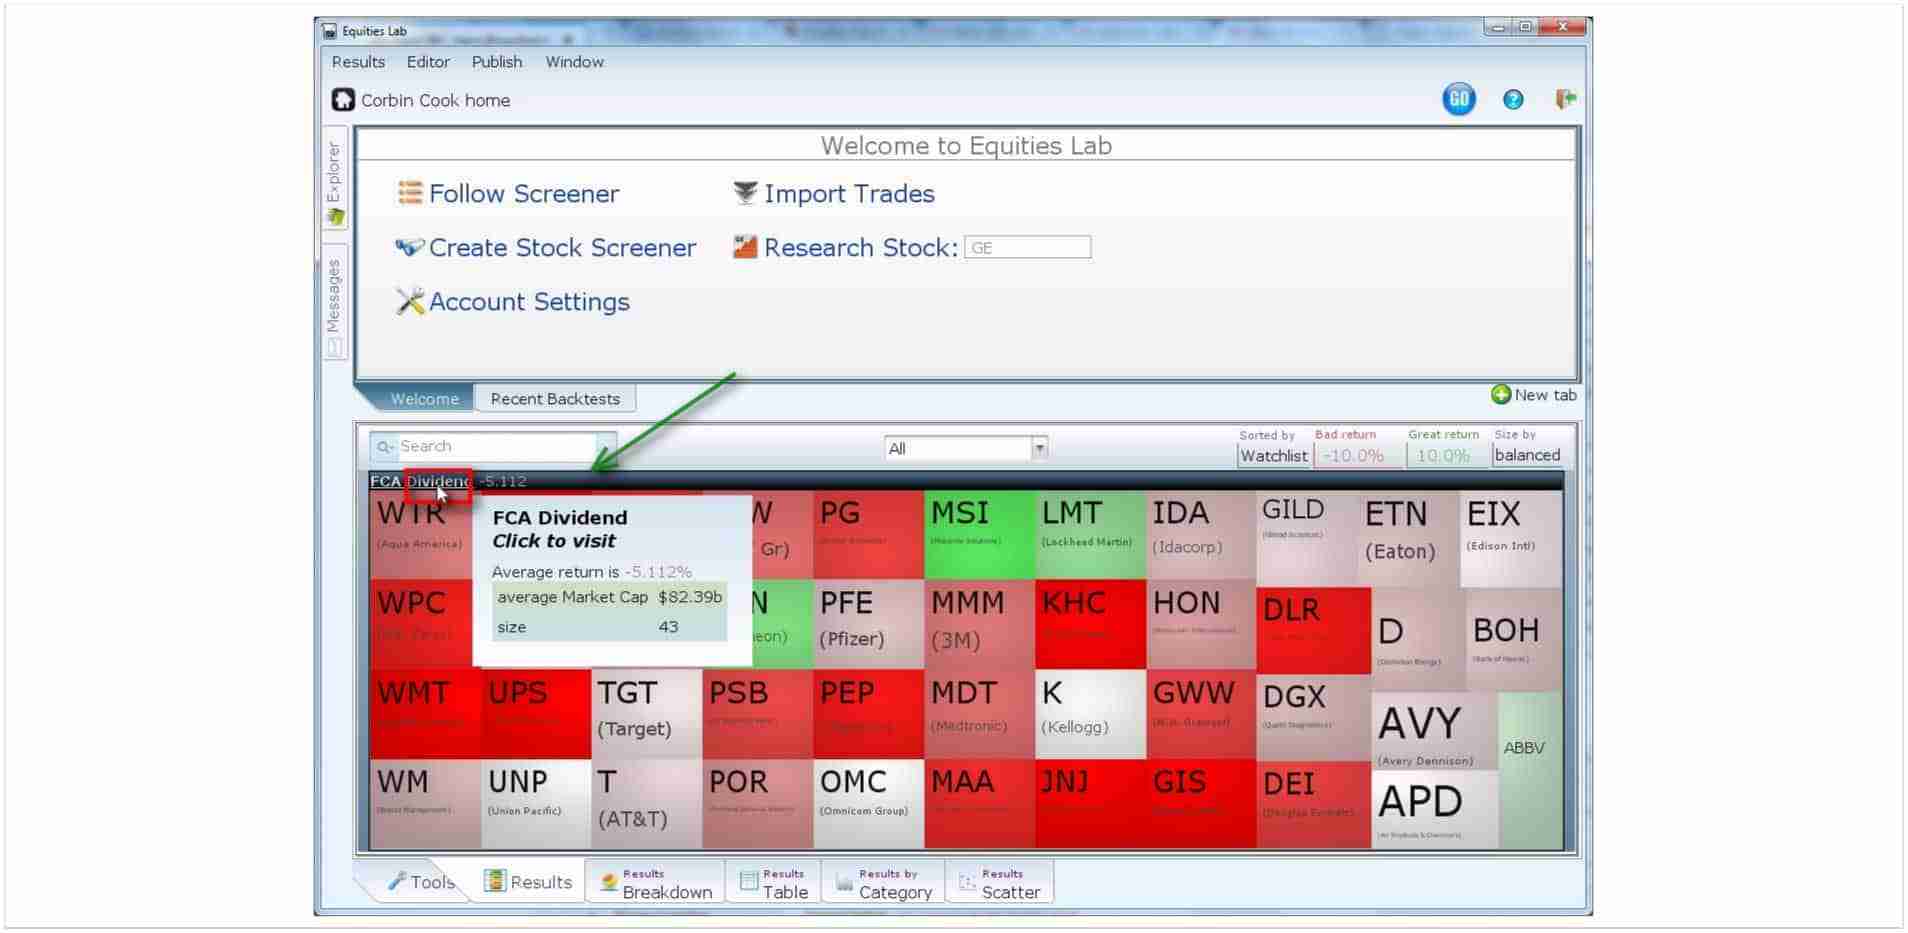 Your Holdings view is a collection of all your watchlists, gathered under title bars for each one. Here we show just one (FCA Dividends). The score is monthly returns, which is a bit short term for our taste. Lets view the watchlist, and change the score.
Create a new tab
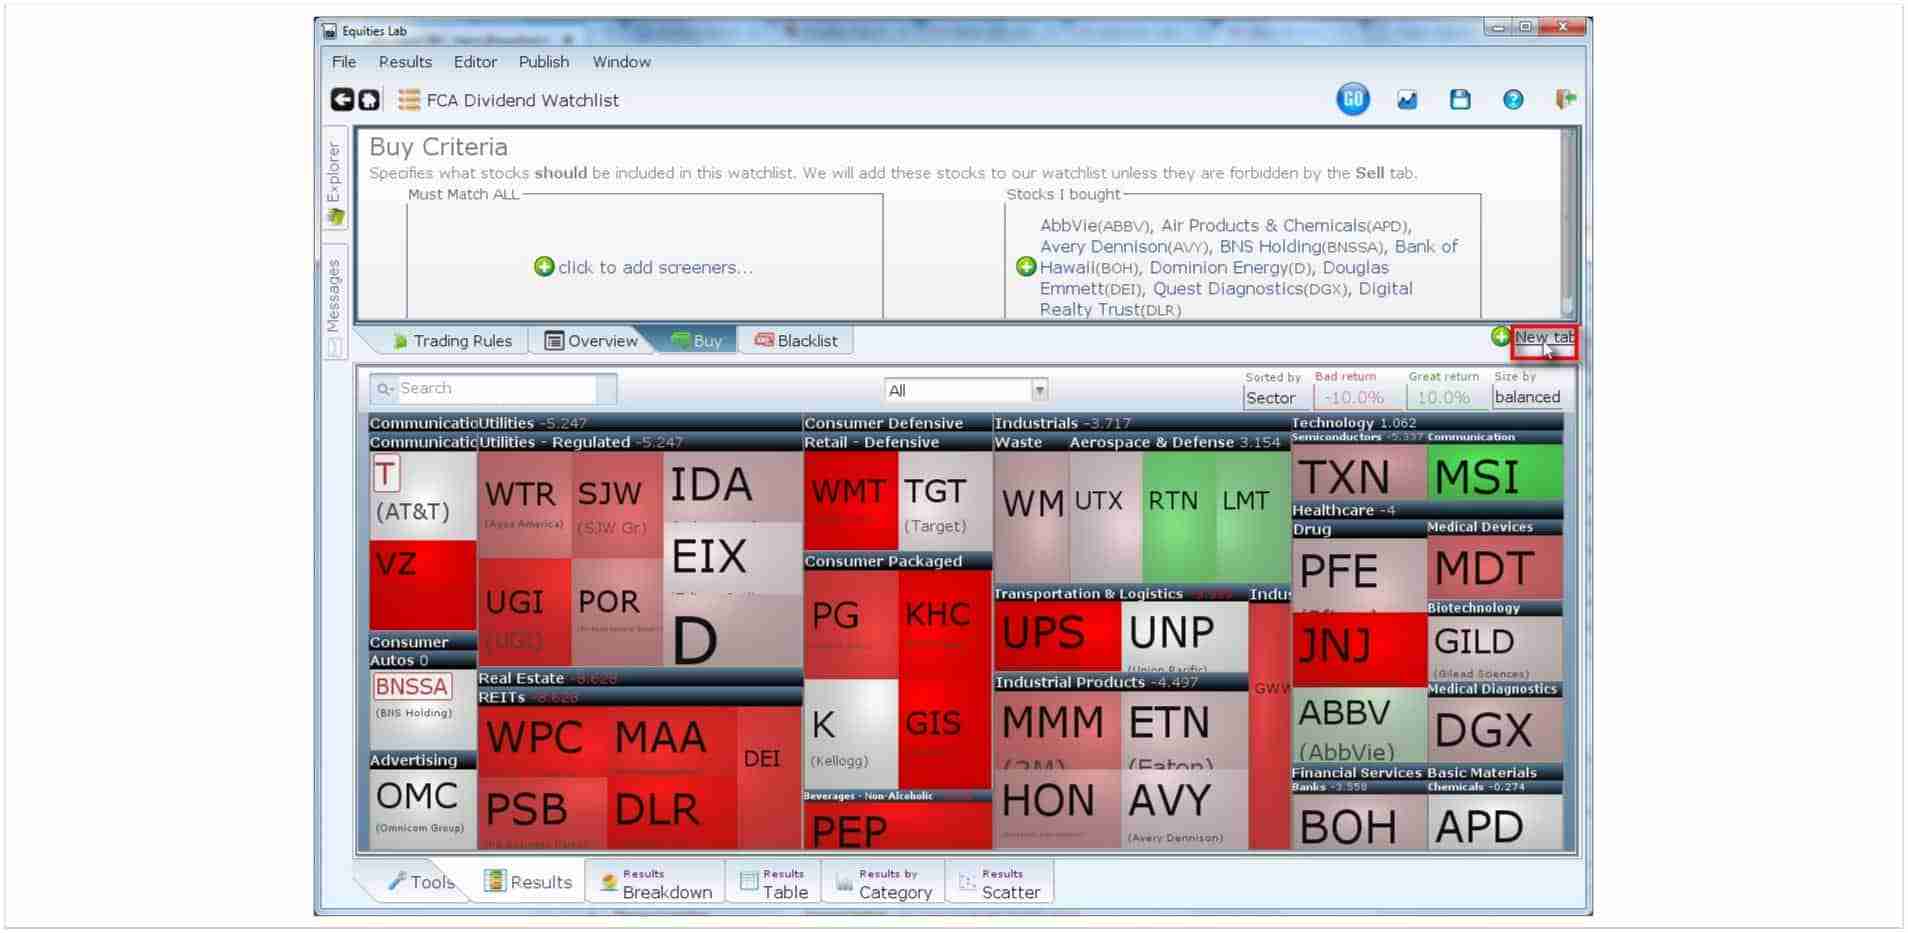
You can see that the stocks in the watchlist are categorized by sector and industry, since there’s just one watchlist. We still see the short term performance. Let’s change that. We need to create a new tab named “score” and put our desired score in it.
Create a new tab by clicking on the New Tab, or typing CTRL T
Name it score
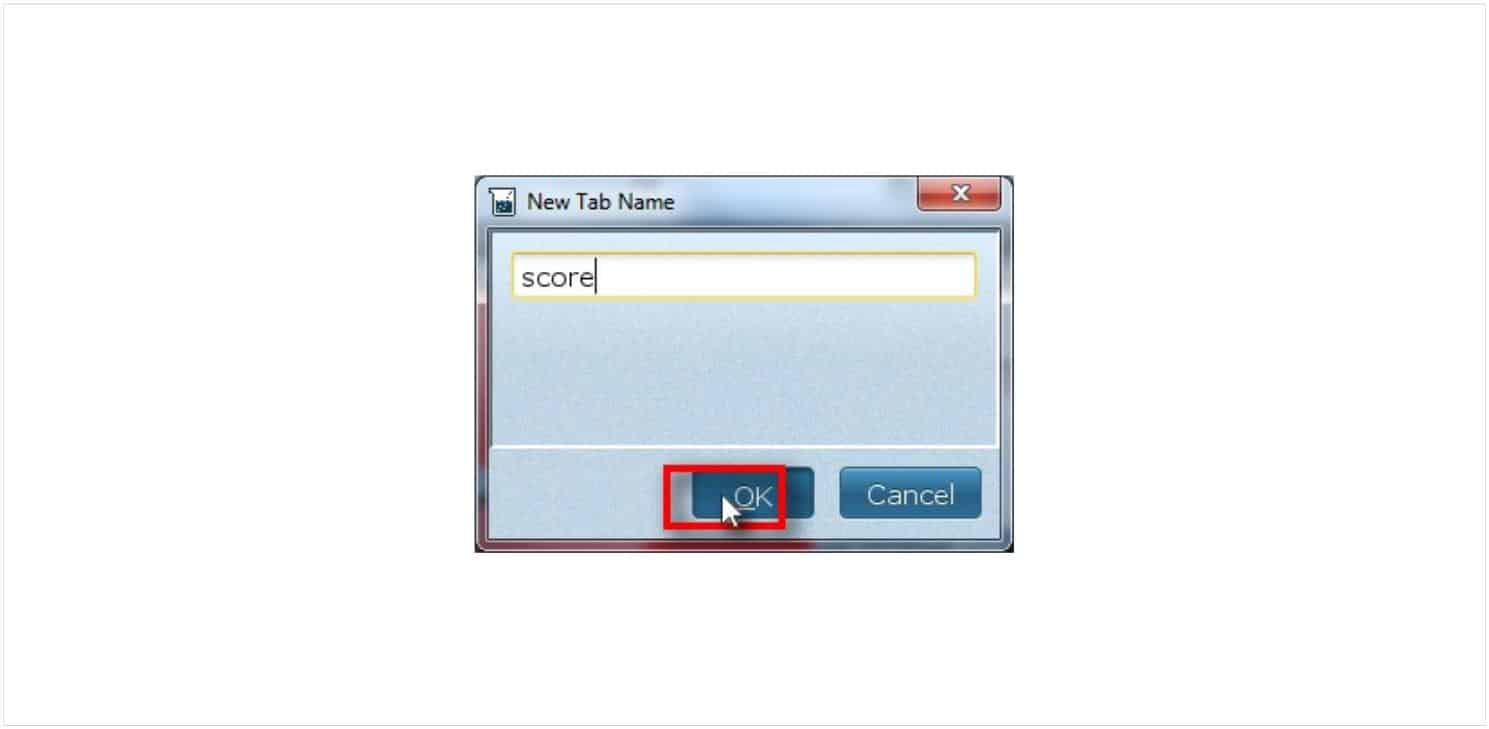
You have to name the tab “score” if you want it to impact the red and green boxes. If you name it anything else, it will have “plot_” automatically added to the front, as Equities Lab assumes you want to plot the variable. You can have as many variables as you want this way, and they can be anything Equities Lab can calculate.
Use the “change” operator
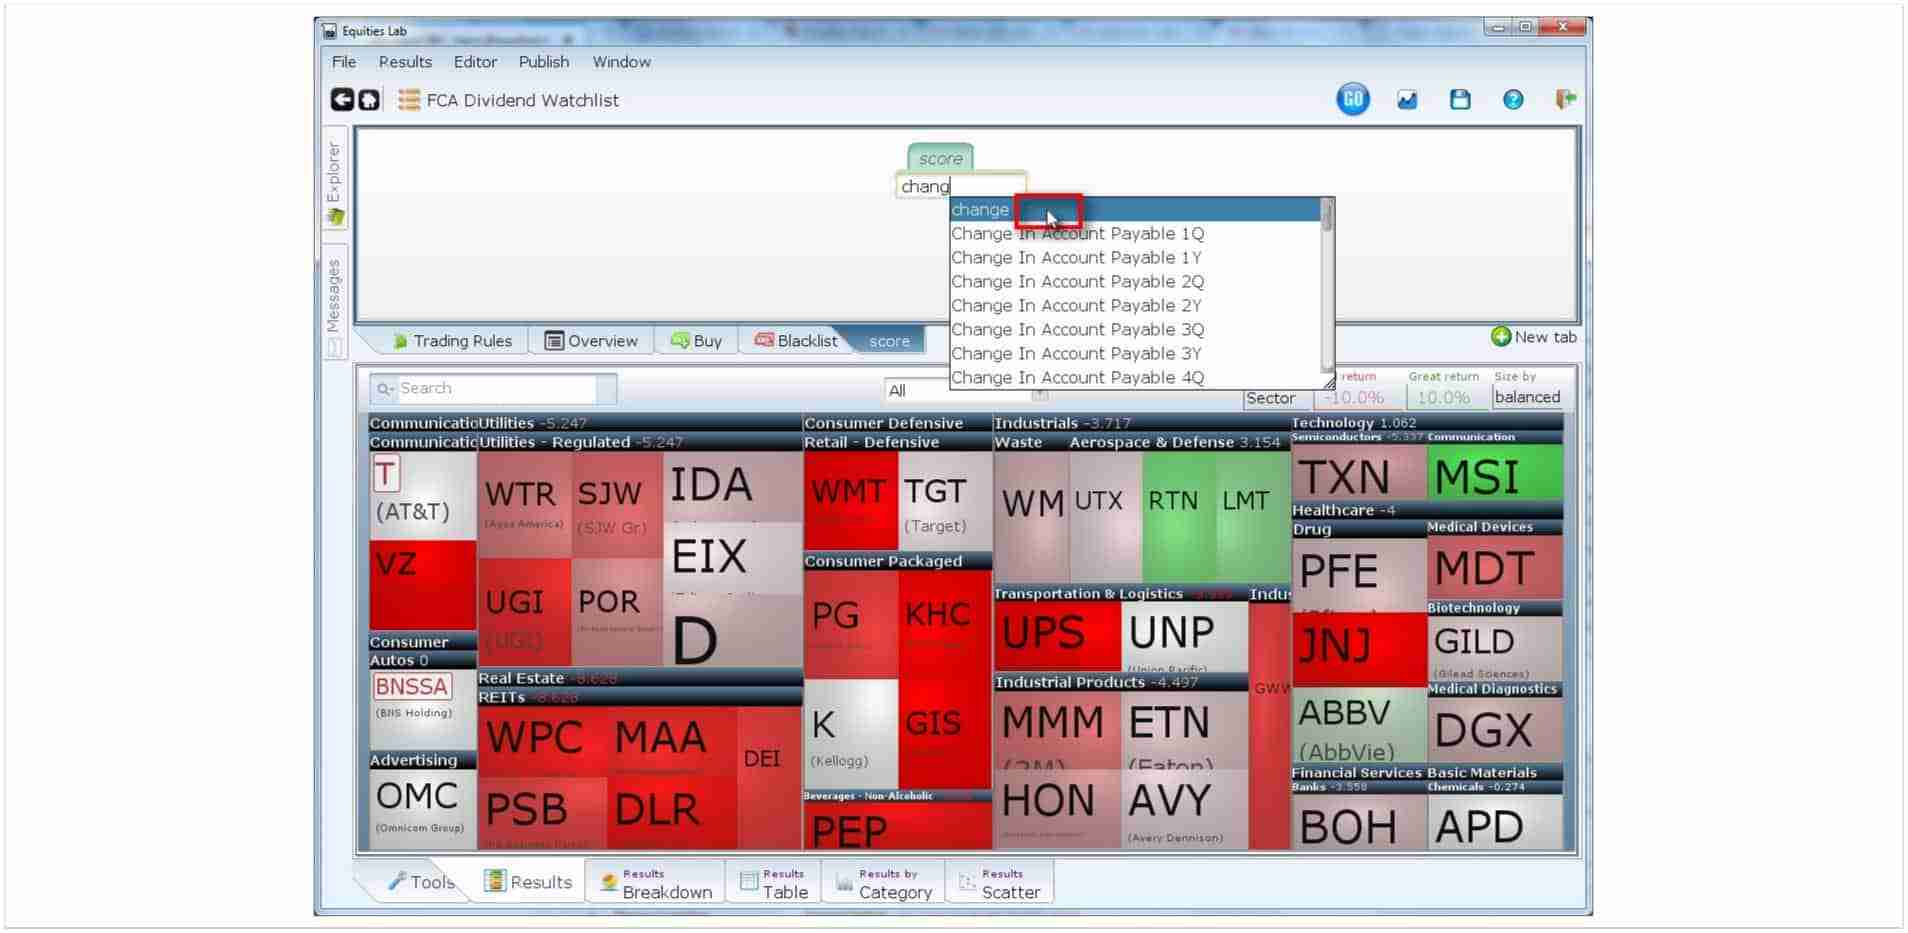
You’ll build up the term “change close 252” step by step, so you can see how the term is built. You could have just typed “change close 252”, knowing that there are 252 trading days in a year, but what’s the fun in that? Notice that the autocomplete shows operators and fields.
Rerun the screen with the new score
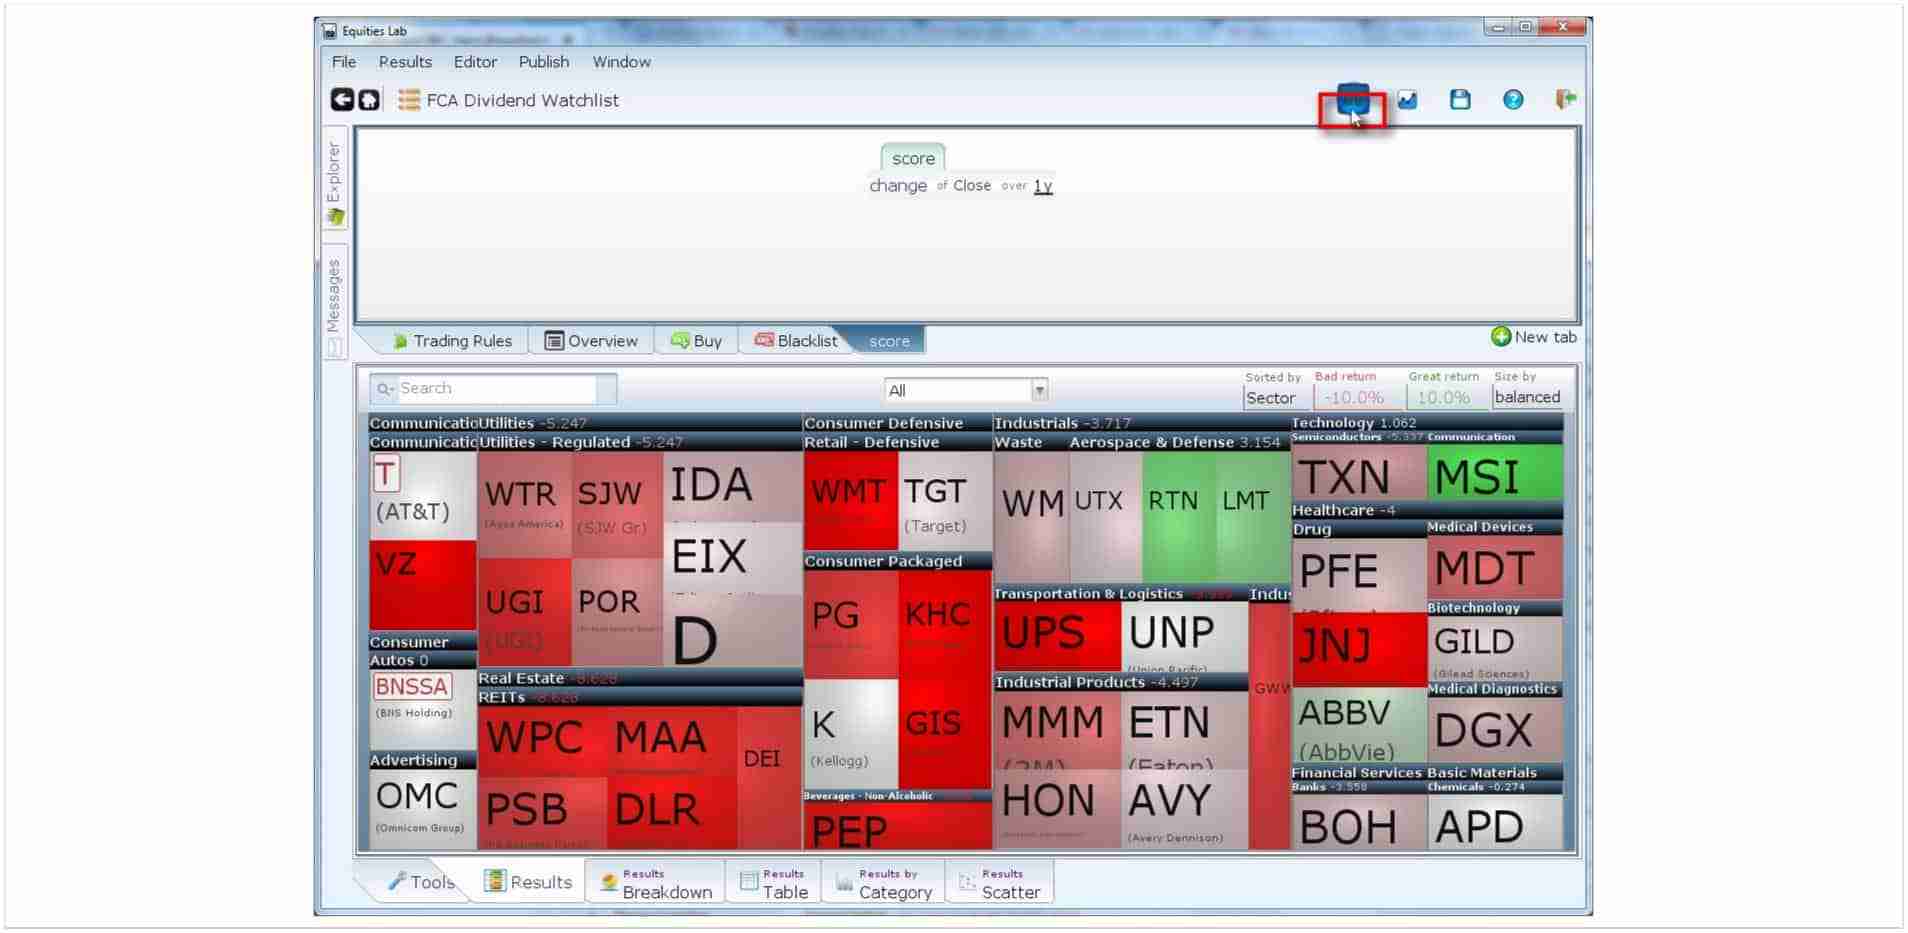
You’ll notice we assumed you put “Close in the first box that appeared, and 252, or 1y in the second box. Clicking on the “Go” button, will run the screener with the new score, and you’ll see different colors.
Change 1y to 2y
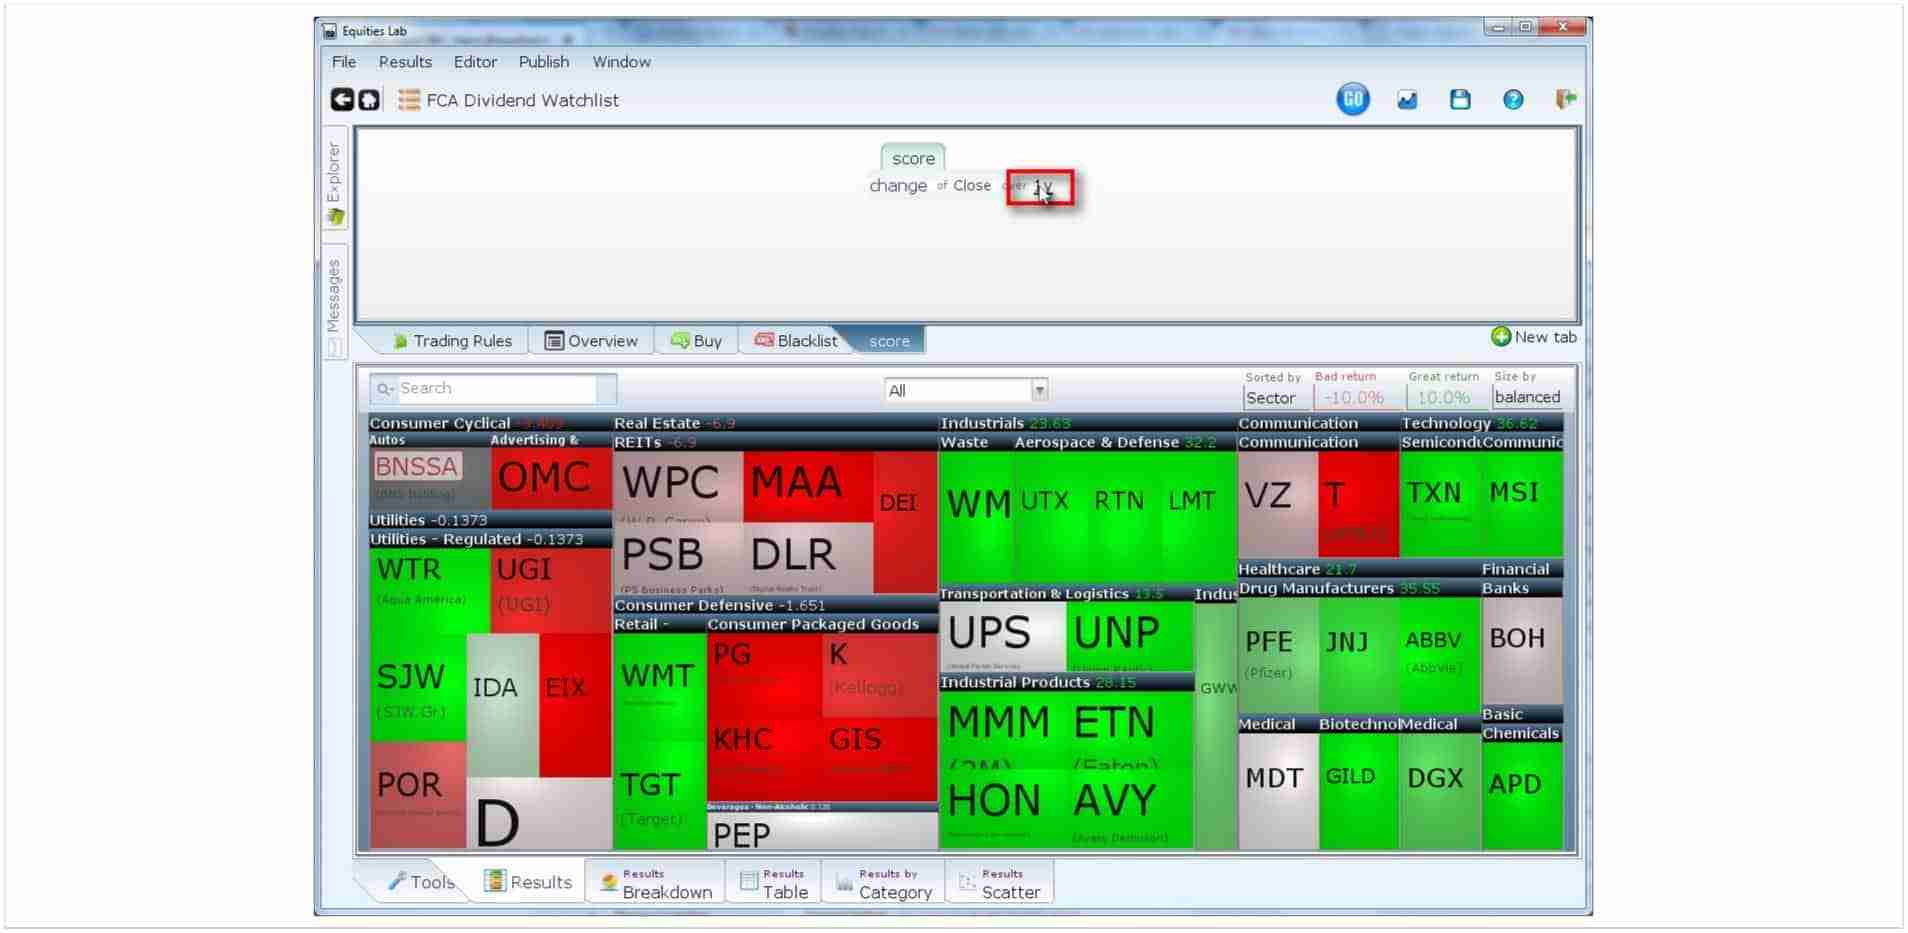
You, suddenly desiring to see two years of performance as a set of colors, want to change the time span being used. So, just click on the “1y” and type 2y or 504 to replace the old value. Then click “Go” again.
Change “Bad return” and “Great return”
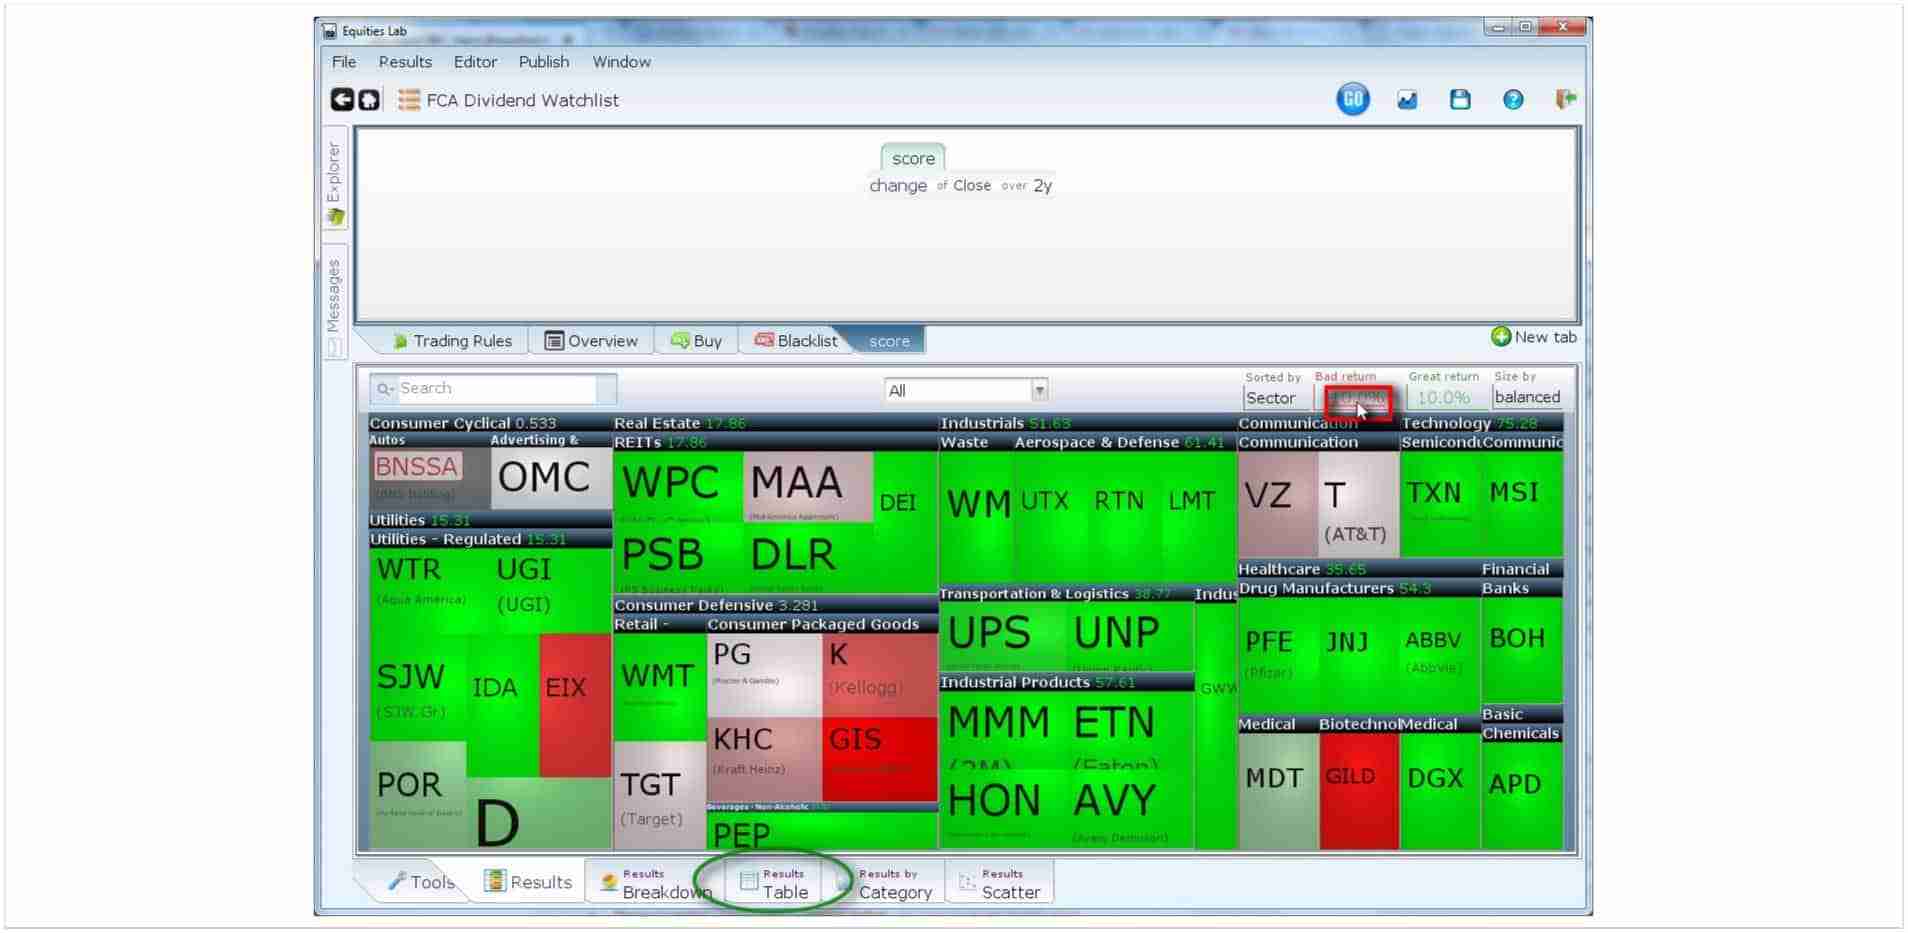
Getting all happy when your stock ekes out a 10% gain in two years is not entirely rational. So, click on the numbers between “Bad return” and “Great return” to adjust these expectations more to your liking. Also play with the “sorted by” and “Size by”.
Bonus points if you enjoy the “Search”, which can search both names and descriptions. Click on “Results Table” to get these results as a table.
Click on any line to see more
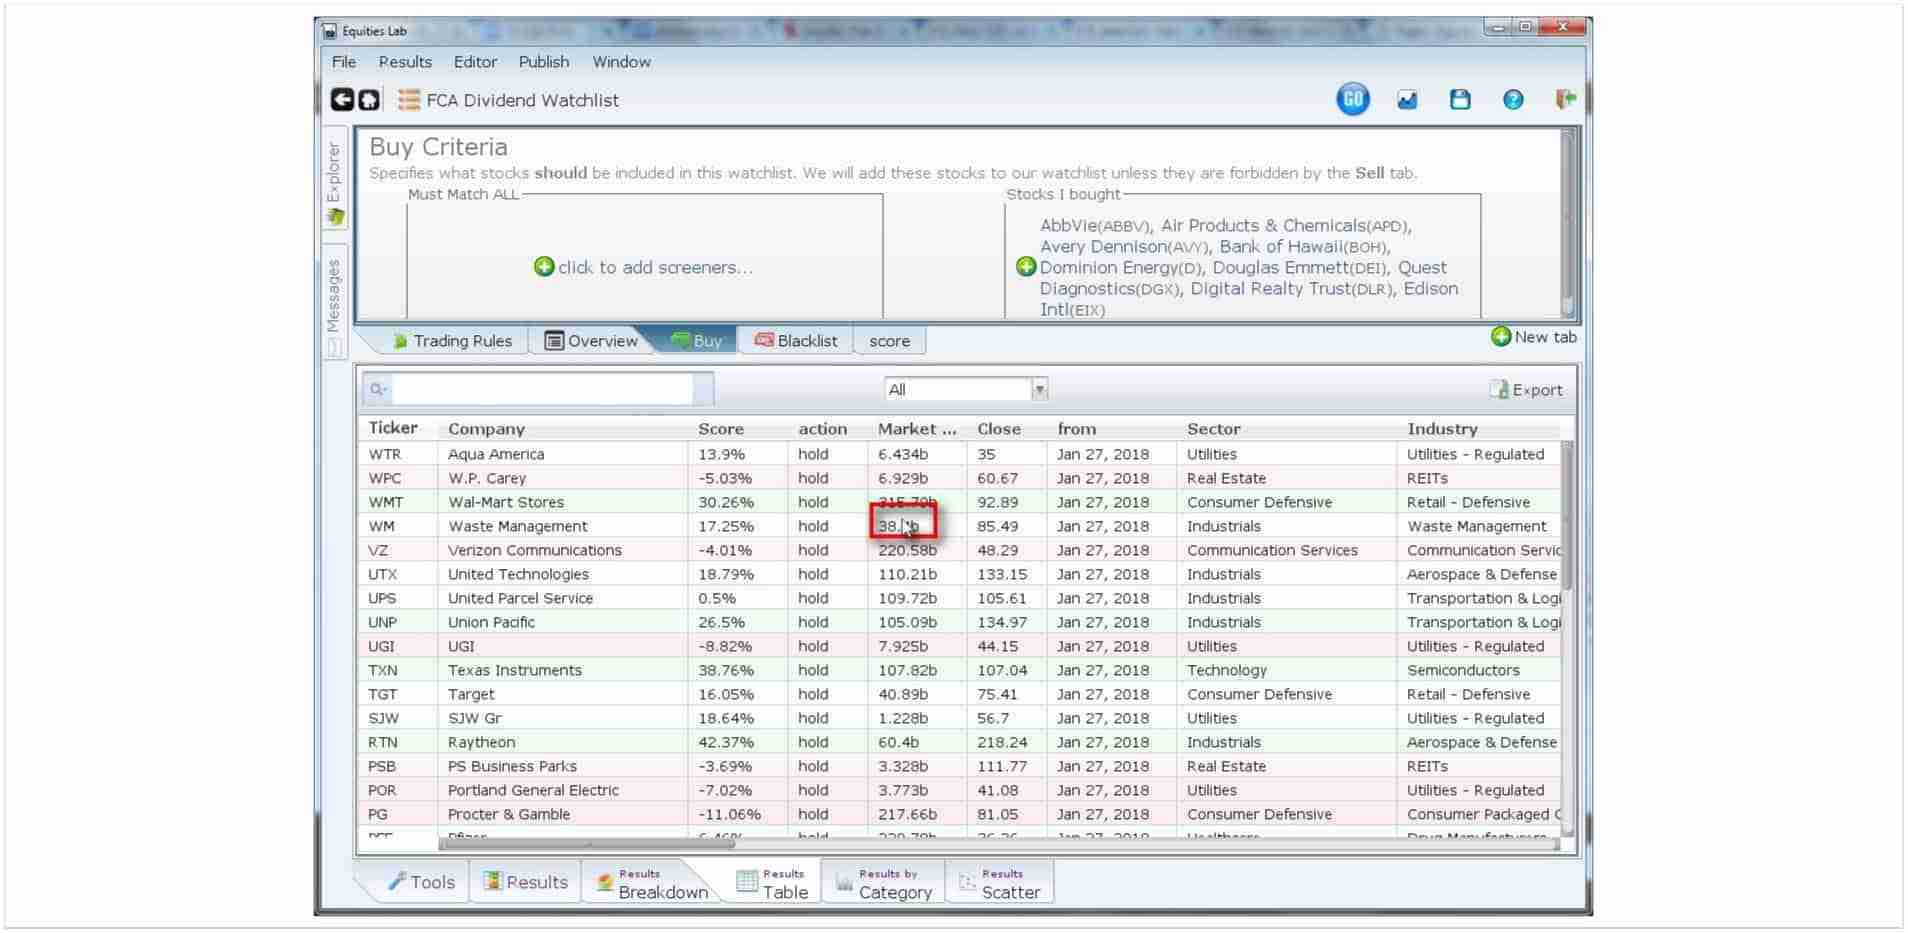
Clicking on a line will bring up more details, or you can scroll horizontally, or sort by clicking on the column headers.
Enjoy the info box
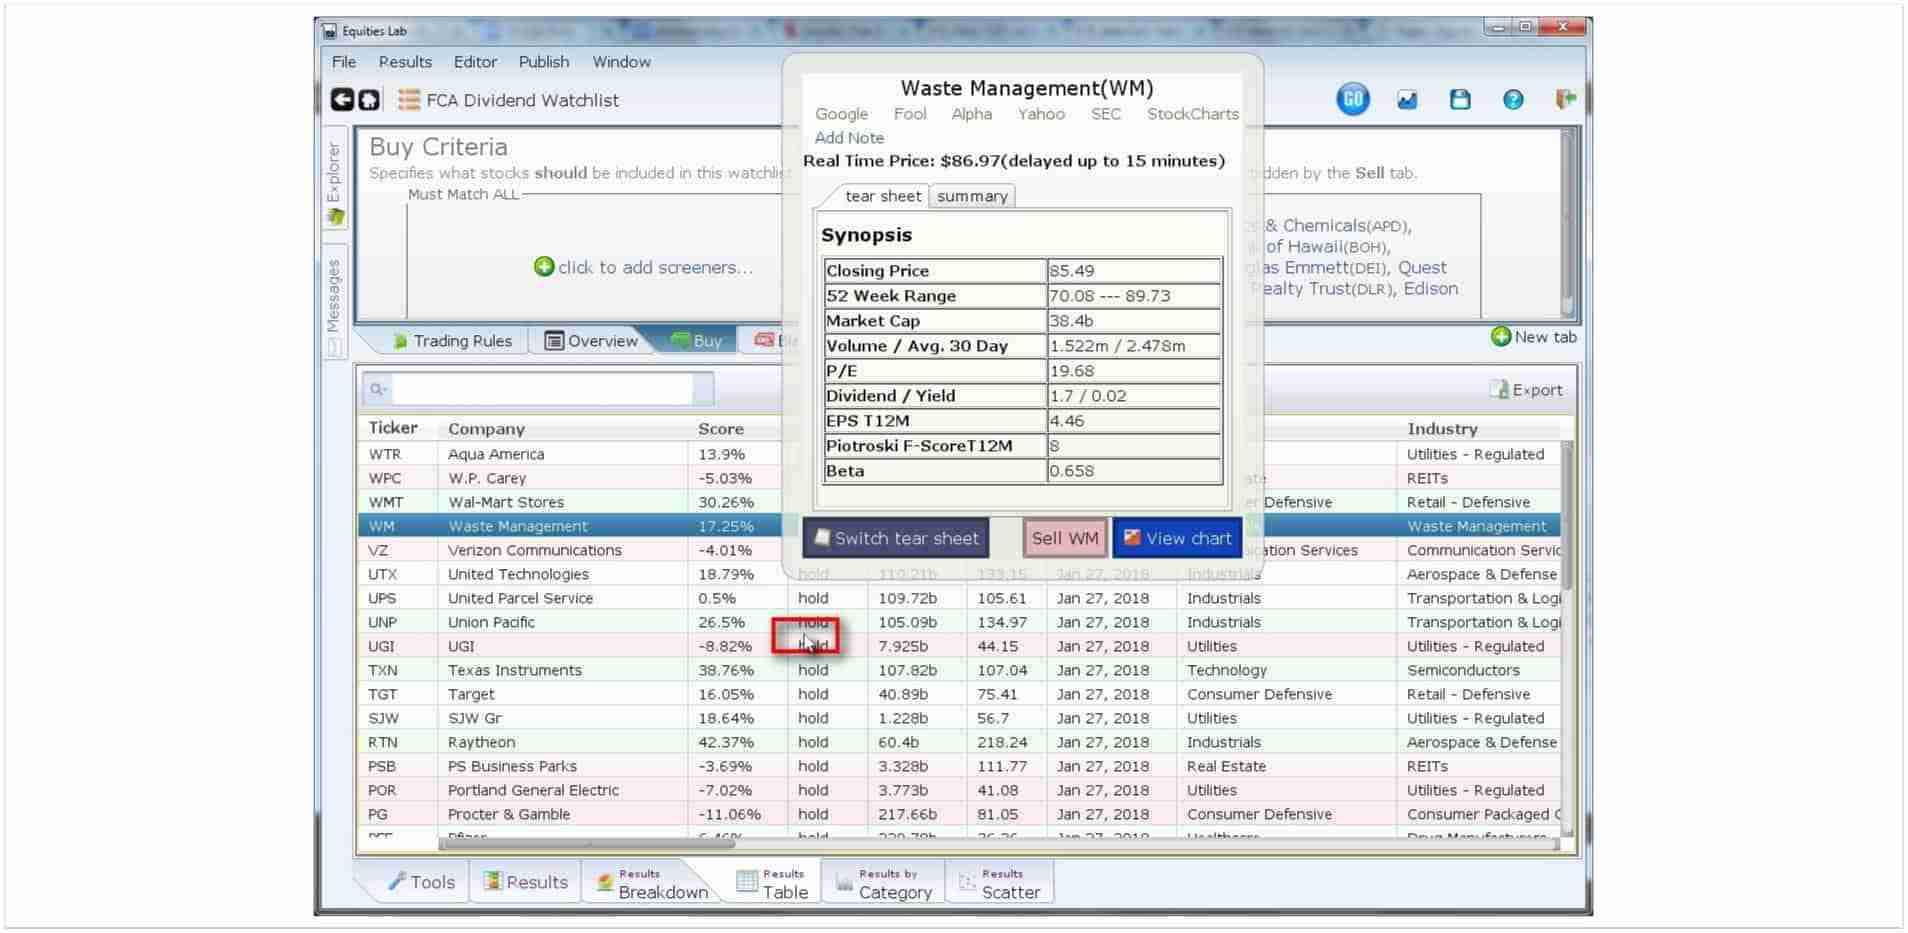
From here you can see news about the stock, read SEC filings, change tear sheets (the panel of numbers below the real time price), let Equities Lab know you sold it, or view the chart.