
Overview
Crafting Strategies
Backtesting
UI Features
Common Models
Tear Sheet – How To Create (2024 Update)
Updated: 5.2.2023
Tear Sheets
Tear sheets are one of the most important and useful features within Equities Lab. However, a lot of people don’t know that you can actually customize and create your very own tear sheets – just like virtually everything else in the Equities Lab software. When we were building this, our mind was always on the end user, and offering you the most versatile and customizable investment software possible. Now, I know that we have a few readers here that don’t know what a tear sheet is, so we are going to start off with that.
What is a tear sheet?
Well a tear sheet, at its core, is basically a table with different pieces of information in it. Tear sheets get automatically attached to stocks and you will have that information on any stock you click on. As stated in the first paragraph, tear sheets are completely customizable and you can even create your own. That being said, we’ve gone through some pretty great lengths to create the basics of what you need so if you don’t want to create your own or edit them you’ll be fine.
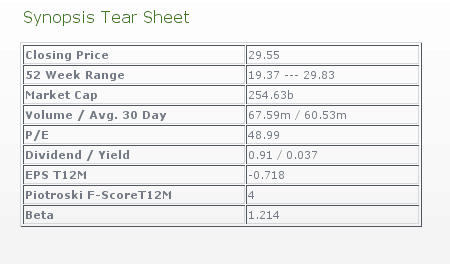
Here is an example of our Synopsis Tear Sheet
Now that we know what a tear sheet is, let’s dive into how we can create our own. Follow the instructions below and you’ll be creating your own jaw-dropping tear sheets in no time!
- Create a plan. What do you want your tear sheet to include?
- For me, I created a “growth in value” score a few months back that doesn’t really outperform the market, but it’s a good green flag indicator. Since I’m more interested in what aspects potential investments don’t pass I’m going to build a tear sheet based on that formula.
- Create a new formula in the explorer
- Name it, Tear Sheet:whateveryouwanthere
- Go over to the editor of the new tear sheet and add an operator into the space such as + or count
- If you are using true/false variables you need to use the count of operator. This is what I need to do for my sheet. However, if you are trying to get specific values use the “+” operator.
- Now, you need to go through and make each of these cells a variable. Later we will come back and rename them.
- To quickly make everything a variable go to each cell and input a single quote, ‘.
- Now go in and in all of the empty cells put in the things you are trying to find
- Once you’ve done that change the names of the variables to “plot_detail_whateveryouwant” .
- Head over to the overview section and double click where the description is. A text editor should open.
- Go to the bottom and click on the “HTML” tab.
- Since most of you don’t have any experience in HTML, here is a template to use.
- <h2>
Tear Sheet Name
</h2>
<table border=”1″ cellpadding=”1″ cellspacing=”1″ height=”393″ width=”400″>
<tr>
<td>
<strong>Your Variable Name</strong>
</td>
<td>
plot_detail_variable
</td>
</tr>
</table>
- <h2>
- Copy and paste this template into the HTML tab
- Between the <strong> tags add the name of the text name of the variable – such as Piotroski score
- Between the <td> tags add the actual name of variable. ie. plot_detail_piotroski_score.
- Now, if you need more fields just copy between the <tr> tags and paste it before </rable>
- Once you’ve filled this out, save the tear sheet and just like magic you have developed your very first Tear Sheet.
Let’s Get Started
Equities Lab will help you grow as an investor, you can test your strategy against historical data so you can accurately improve results. Check out the rest of our articles to find the best strategy and helpful tips that will help you in your investing plan.