
Overview
Crafting Strategies
Backtesting
UI Features
Common Models
Charting Tool
Using Equities Lab as a Charting Tool
When most people think of “charting tools” when it comes to the stock market, their minds begin to wander to technical analysis and day trading. However, chart analysis doesn’t have to mean you’re going to look for a head and shoulders pattern or for when the price crosses a 50 day moving average. With over twenty years’ worth of data, you can use Equities Lab to chart fundamental factors and track how well a company truly runs over time – not just how much it costs.
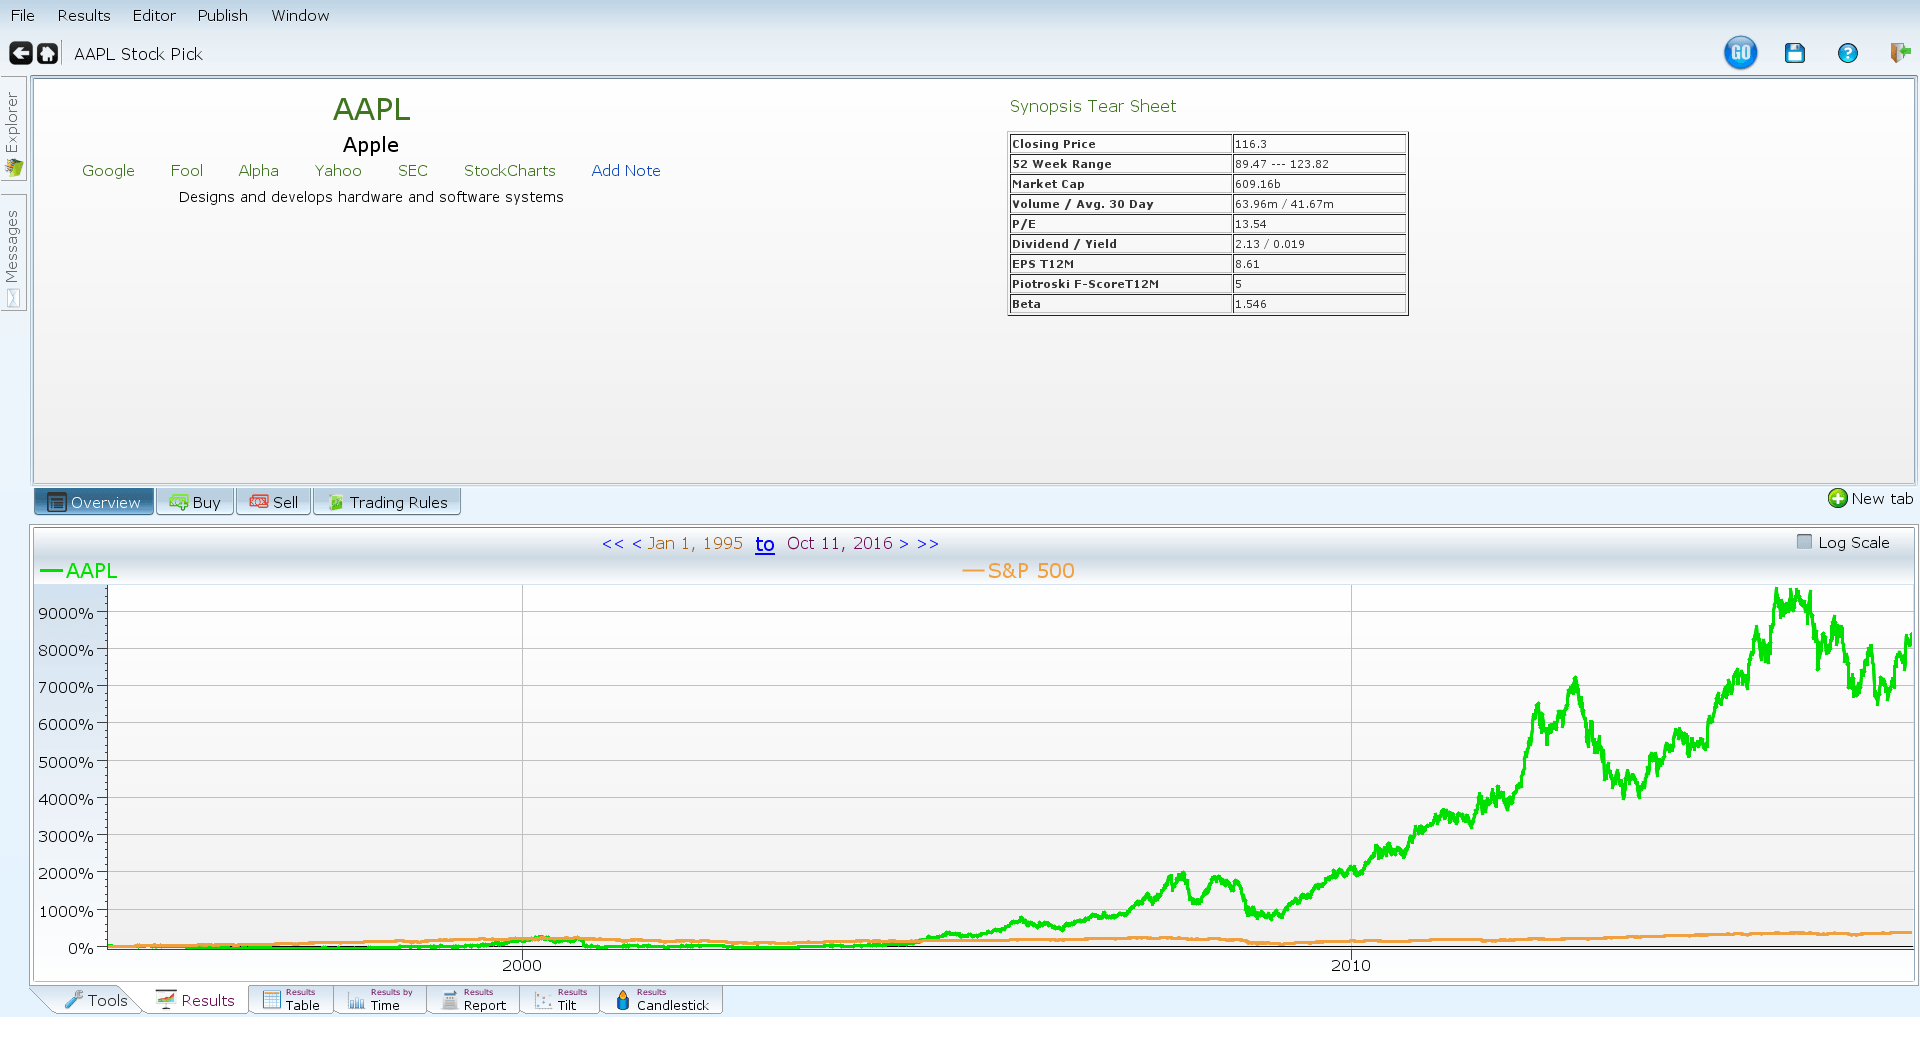
Here is a basic chart of AAPL since 1995. Though it tells me that Apple has increased in price over the past twenty years, it isn’t very helpful. Let’s change that.
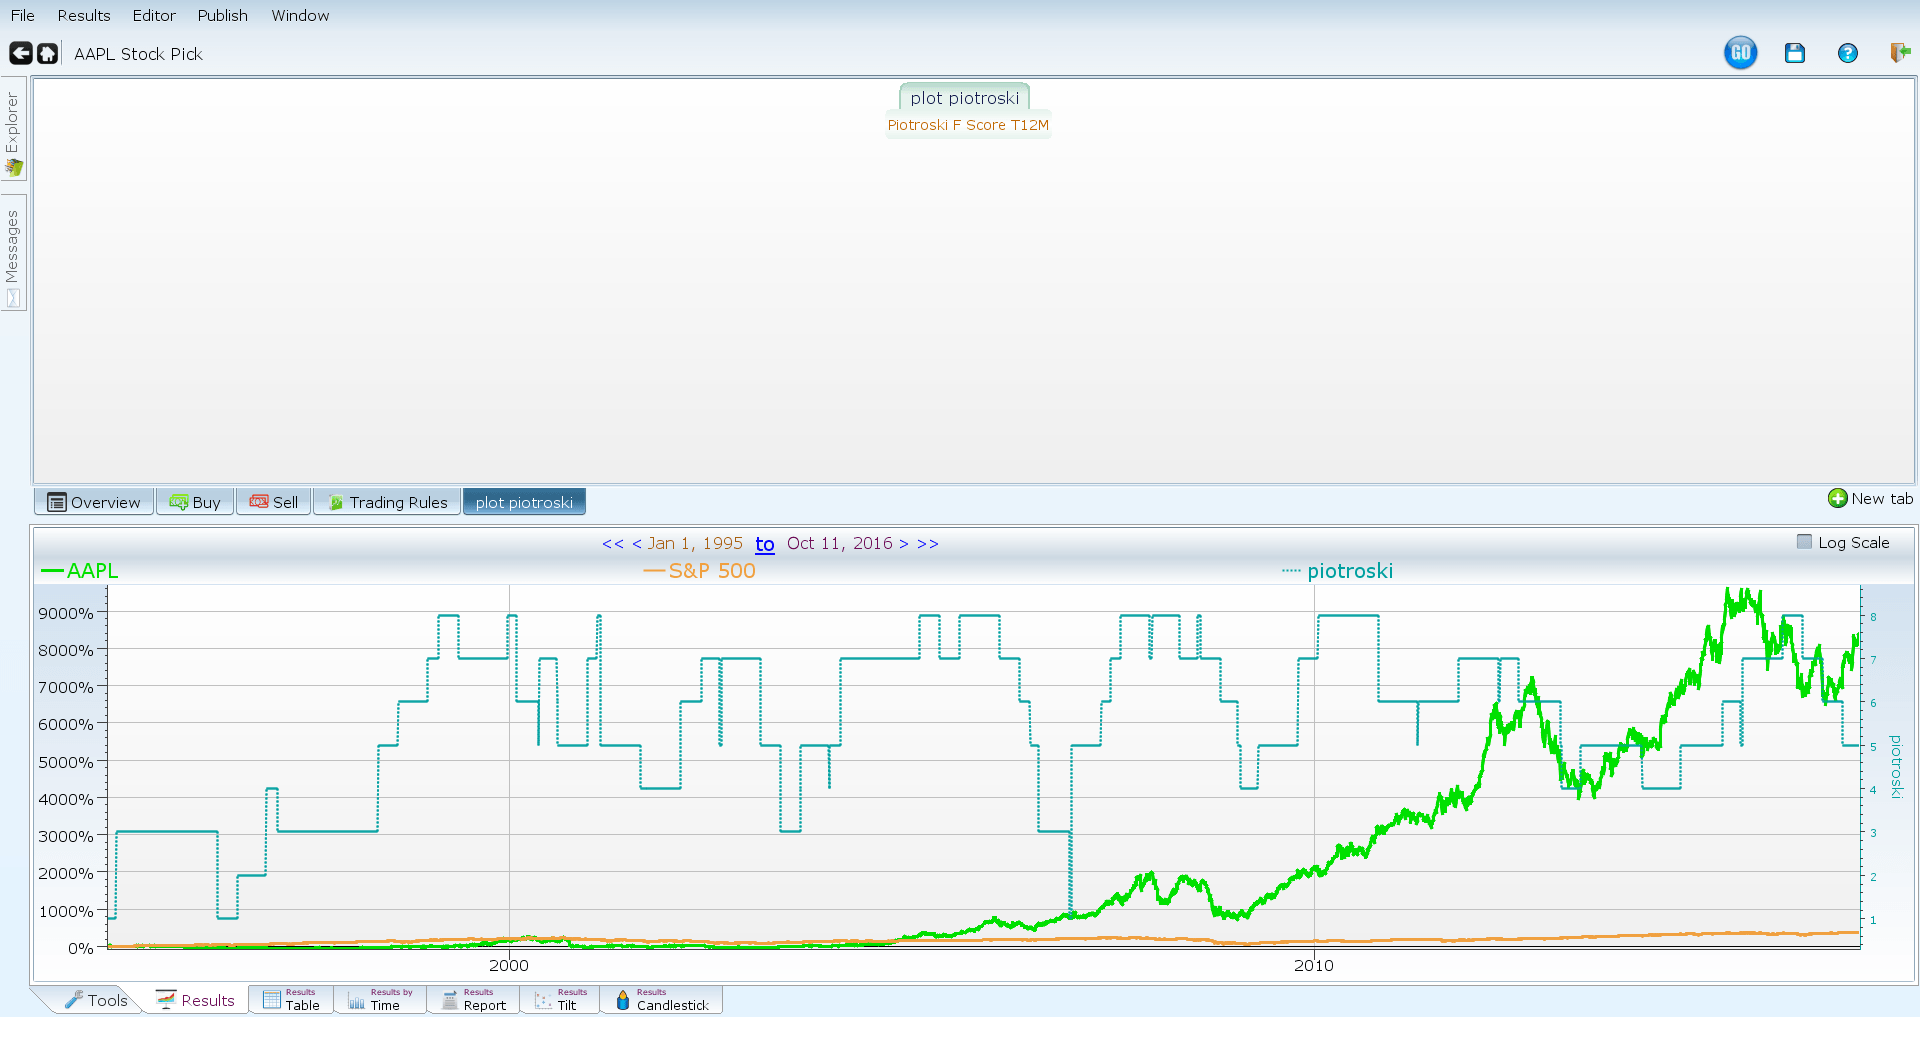
Above I have plotted Apple’s Trailing 12 month Piotroski score – a score created by a University of Chicago Professor named Joseph Piotroski. The Piotroski score looks at fundamental factors, such as increasing net income and sales, and compiles a score from 0-9. In our studies we have found that companies with an increasing Piotroski score over the period of a few years and a Piotroski score of greater than 7 perform best when compared to the overall market. Knowing this number for Apple as of the present day, as well as all of their Piotroski scores for the past twenty years, gives us a better understanding of the underlying company. Apple’s Piotroski score and history aren’t the best, but we will work with it.
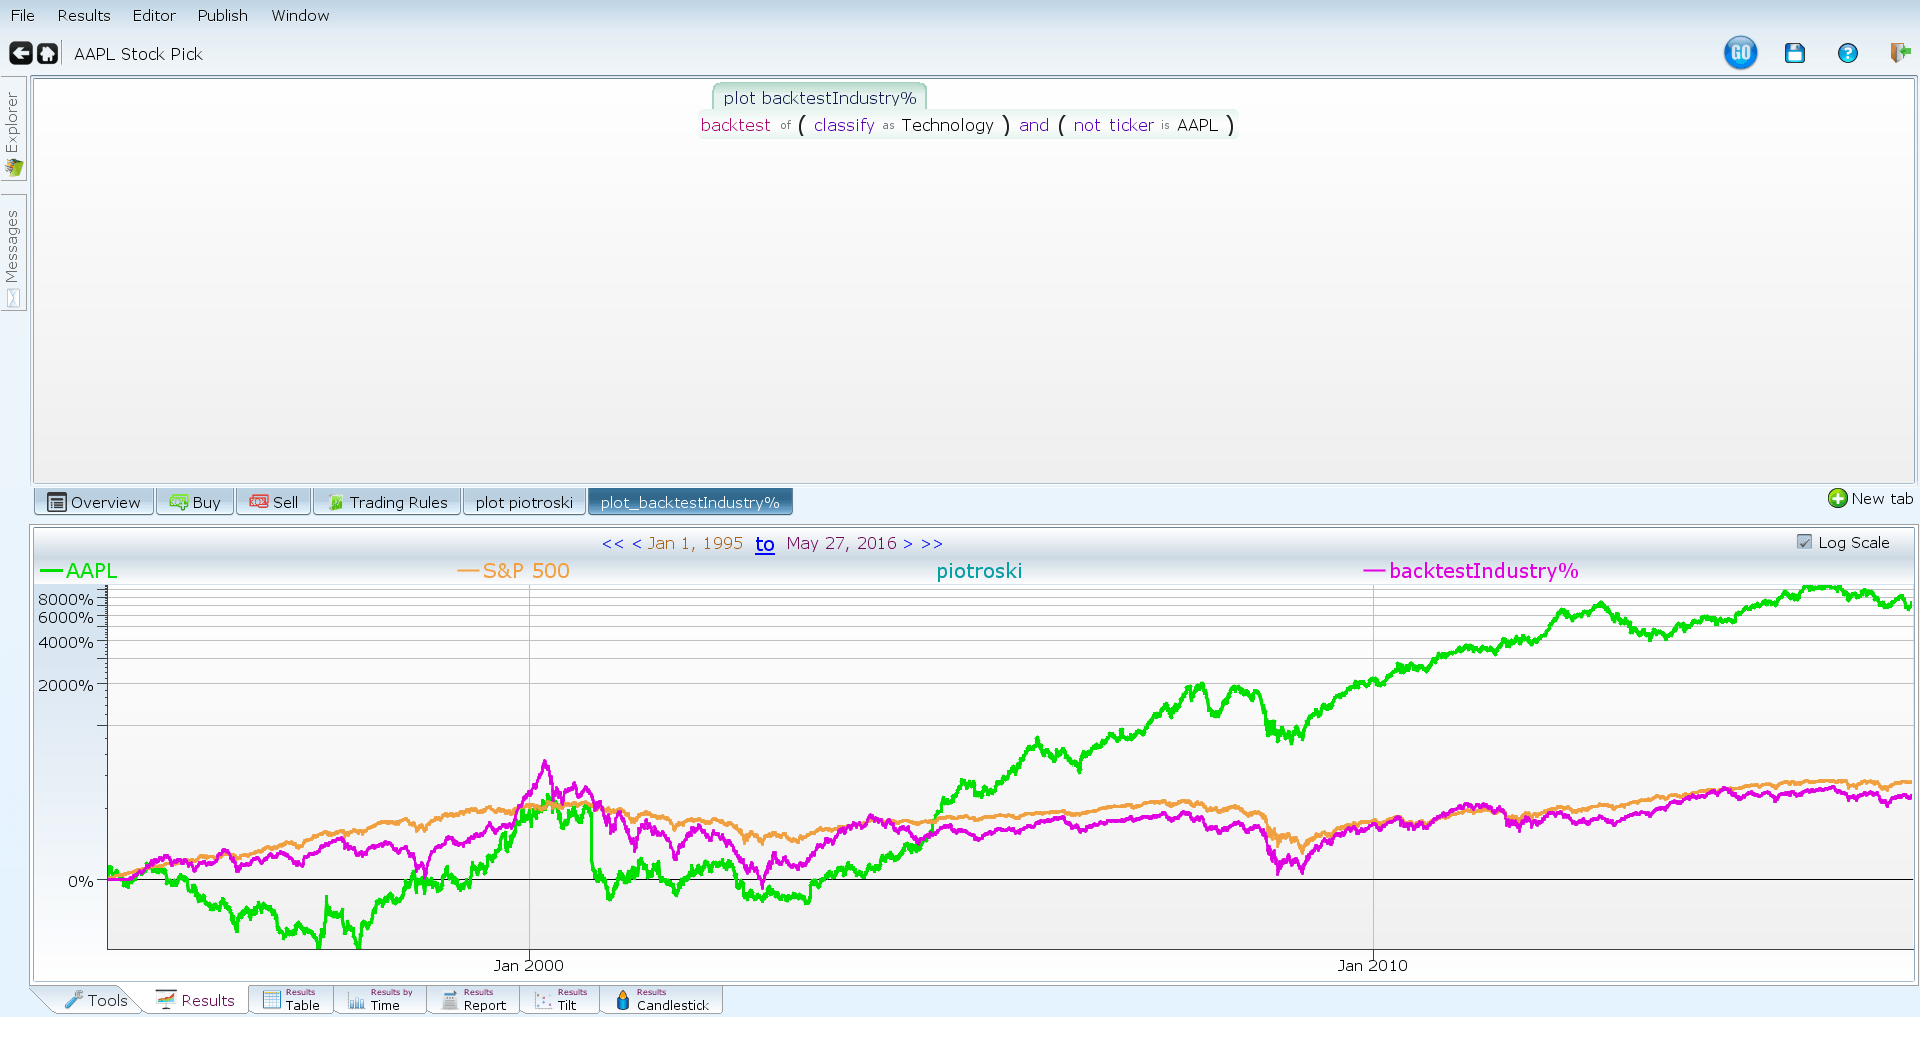
Here we went ahead and created a screen within the stock pick. I wanted to compare Apple’s performance over the past twenty years to the performance of the entire technology sector minus Apple. This gives you the ability to eliminate any skewed data from including the stock you’re analyzing as well as get a general idea of how your stock pick compares to a relevant market. The difference in performance is so significant that I actually had to log scale the chart. In the past twenty years Apple has returned over 8000% while the technology industry as a whole minus Apple returned a paltry 300% in that same time frame.
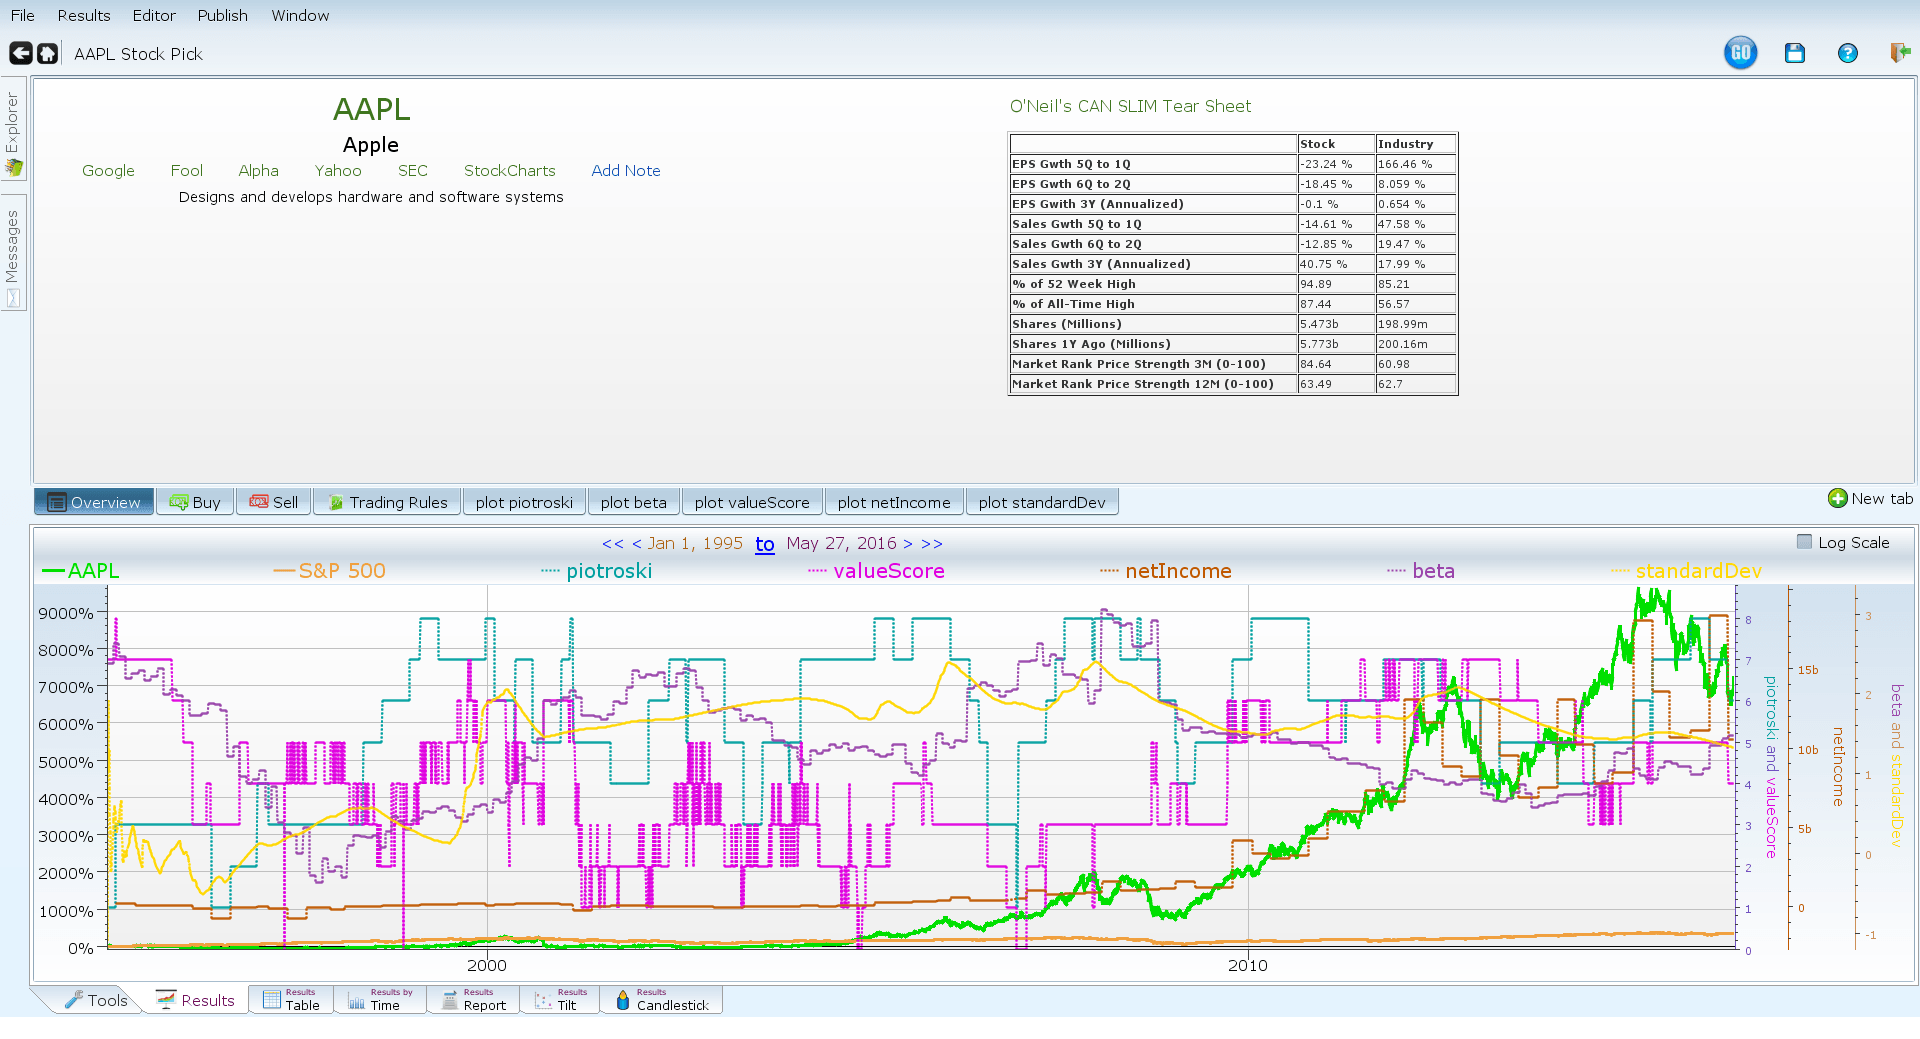
The two examples I gave in this article are incredibly simplified, and as time goes on we will discuss the intricasies of charting with Equities Lab. In the meantime, just play around and put the variables that you personally believe will be helpful to your investment strategy. This final chart that I have included above is one that I would personally use when it comes to analyzing a potential investment opportunity. I can see any number of scores that were either created by me or already existing within the software, look at the change in the company’s net income and any other item that could be found within the financial statements over time, and finally, I even get to calculate standard deviation and establish a risk profile associated with that company. When I say you can do just about anything you’d like within Equities Lab, I’m not stretching the truth, it just takes a little time.